Requirement
To implement a strategic planning solution is quite a common requirement. Usually the time horizon for strategic planning is 3-5 years. In contrast to operational planning it is also quite typical to plan in percentage rather than in absolute numbers.
For our example let us assume an existing planning solution for the current year with sales quantities and the requirement is to expand the solution with a strategic planning feature in which the planners should be able to enter percentage growths.
Implementing the Strategic Planning Data Model
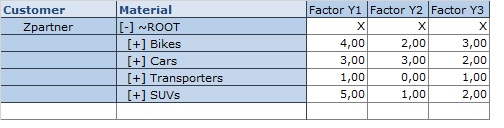
We start with creating key figures SPFY1, SPFY2, SPFY3 representing the factors in percent for the next 3 years. We choose Aggregation “No Aggregation”. This setting will provide the possibility to use “Disaggregation Copy” later on in the planning query.

The disaggregation behavior “Disaggregation Copy” allows us to copy the entered value on every combination in the data scope of the entered value.
E.g. we could enter 5% on a product group and every product in the product group will receive the 5% value.
Afterwards create an ADSO, Composite Provider, Aggregation Level and a Query with the data model which fits to your planning application.
In our example we use Customer and Product in the rows. We use SPFY1, SPFY2, SPFY3 as input ready columns with “Disaggregation Copy” behavior.
The background filter needs to be set up according to your requirement as well. In our case e.g. sales organization, version and InfoProvider.
The result at this point is an input ready query in which the planners can enter percentage values for strategic planning for the next 3 years which can be used to create your strategic plan in the next step.
Combining Operational and Strategic Planning
In this step we have a closer look how to combine the absolute sales quantity figures with the percentage values.
Let us assume the operational plan is in InfoProvider A and the strategic plan in InfoProvider B. I would like to show you a very performant and elegant way to multiply the numbers by a FOX formula.
For this purpose, create an aggregation level based on a composite provider containing InfoProvider A and InfoProvider B. The data model from InfoProvider A will differ from InfoProvider B. The result of the multiplication will be written to InfoProvider A in our case.
Within FOX you could read the factor with a statement like this:
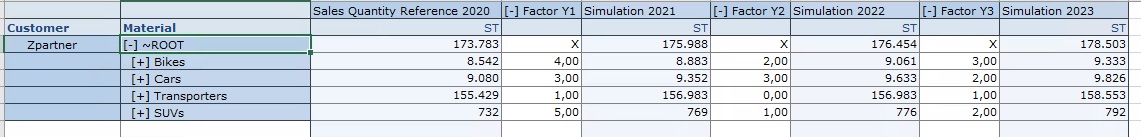
FACTOR1 = {SPFY1| 0VERSION = '#', 0INFOPROV = 'B'}.
With this statement you access the InfoProvider B which differs in terms of structure by putting a pipe sign | and stating the characteristic values you would like to access.
This approach is quite useful for reading reference data from a different InfoProvider.
The characteristic values used after the pipe don’t have to be within the filter of the planning function. It is sufficient that InfoProvider B is part of the data model.
The rest of the logic is quite straight forward and could look like this:
VAL1 = { 0G_QVVABS } * FACTOR1
{ 0G_QVVABS, YEAR1 } = VAL1.
And combining the result in a single query could look like depicted in the following graphic. Note that the user can enter a percentage values and immediately can see the result in terms of absolute sales quantity figures. Quite powerful, isn’t it?

You could use this possibility in any setting where you need reference data from a data model which is different from your planning model.
In many applications you will find complex logic for the same purpose, like jumping into function modules. I think many times you could replace this approach by the given approach, just give it a try.
Summary
An approach for multi year planning within SAP IP was stated. With the given approach reference data with a different structure can be used to create your multi year plan. Complex technical implementations could be avoided by sticking to FOX within the planning functions and the “Disaggregation Copy” function within the query.