Beitrag bearbeiten
Es gibt eine automatische Speicherung dieses Beitrags, die aktueller ist als die unten stehende Version.Die automatische Speicherung ansehenTitel hier eingebenHow to: Trace widgets in SAP Analytics Cloud stories connected via HANA Live Data Connection
SAP Analytics Cloud is a powerful tool to visualize data. Even though it is a cloud framework, it could be very helpful in some cases to get a look behind the scenes.Objective
In that blog post we try to analyse a story build in SAP Analytics Cloud with HANA Life Data Connection to a SAP Business Warehouse release 7.50 on SAP HANA database 2.0. The objective is to get a deeper knowledge of widgets included in the story in order to help to understand communication between frontend and backend.Setup
We use the following setup for creation. SAP Business Warehouse release 7.50 on SAP HANA database 2.0 connected via HANA Live Data Connection to SAP Analytics Cloud. The model was built on a generated External SAP HANA view for reporting out of a SAP BEx Query.SAP Analytics Cloud:

SAP Business Warehouse release 7.50

SAP HANA database 2.0

Connection
Within SAP Analytics Cloud we are using a HANA Live Data Connection
SAP BEx Query and External SAP HANA view for reporting
We created a story on top of a model out of a SAP BEx Query named ZSACM000_REP_0001 with flag „External HANA view for reporting“ activated as you can see in properties of TR: RSRTQ We checked the generated external SAP HANA view for reporting in TR: RS2HANA_ADMIN in order to be able to generate the model in SAP Analytics Cloud.
 In SAP Analytics Cloud we created a model via HANA Life Data Connection and named it like the SAP Bex Query.
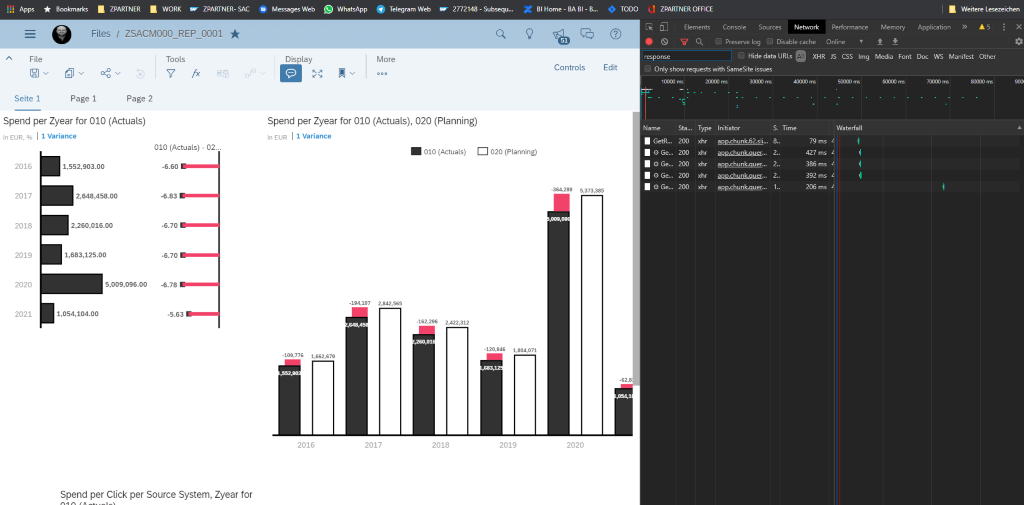
 Based on that model we built a story in SAP Analytics Cloud including 3 charts.

Analysis
Our first objective is to get a deeper knowledge of the requests sent to backend and find which object was doing a request to backend. Therefore we hit F12 to activate DevTools in google chrome and open the story we created.
Requests
Now we go to the „Network“ tab of the chrome DevTools and filter the result to “response”
 4 “GetResponse” lines appear and reflect the requests done to backend.

Find the widget
Have a detail look at the second GetResponse by clicking on it. In the Headers we open Request Payload click on “view parsed” and show the full JSON string of the request. At the very end we find the following tag:
WidgetId„:[„521d7a78-db5a-4076-9b64-b2bb29782d3a“].
At the very end we find the following tag:
WidgetId„:[„521d7a78-db5a-4076-9b64-b2bb29782d3a“].
 Now go to „Elements“ tab of the google DevTools and search for the widget id – in our case “521d7a78-db5a-4076-9b64-b2bb29782d3a”.
Click on the line where the id was located. Now the widget that did the request is marked in your story.
Now go to „Elements“ tab of the google DevTools and search for the widget id – in our case “521d7a78-db5a-4076-9b64-b2bb29782d3a”.
Click on the line where the id was located. Now the widget that did the request is marked in your story.

Response
We are now aware of which widget of the story did the request, we had a look at before. To get more insights, we can have a closer look to the response of the backend including data and metadata. To achieve this we get back to „Network“ tab and select Response area. Now the response JSON will apear. You can copy the response JSON to a tool of your choise to get a better view on it and be able to analyse it easier.
In our case response you will find for instance calculation view name in the DataSource Area as a metadata.
You can copy the response JSON to a tool of your choise to get a better view on it and be able to analyse it easier.
In our case response you will find for instance calculation view name in the DataSource Area as a metadata.
 Also performance Data is included with calls, times, runtime and executing user, that can help to identify bottlenecks or find data for maintenance.