Hi everyone, today we are continuing this blog series with chapter 2. As you remember in chapter 1, we have created a space.
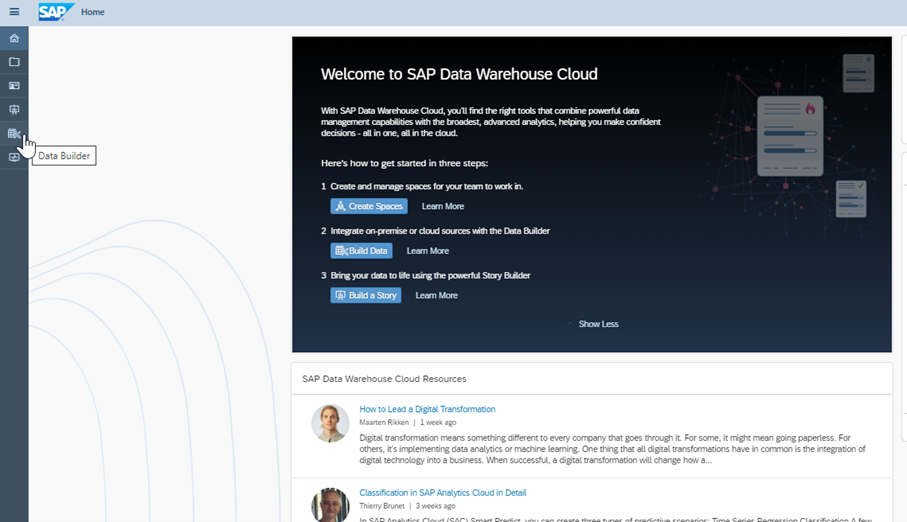
In this chapter, we will have a look on how to create a data model with SAP Data Warehouse Cloud. As a starting point, let us navigate by clicking the menu data builder (see Fig. 1 on the left panel).
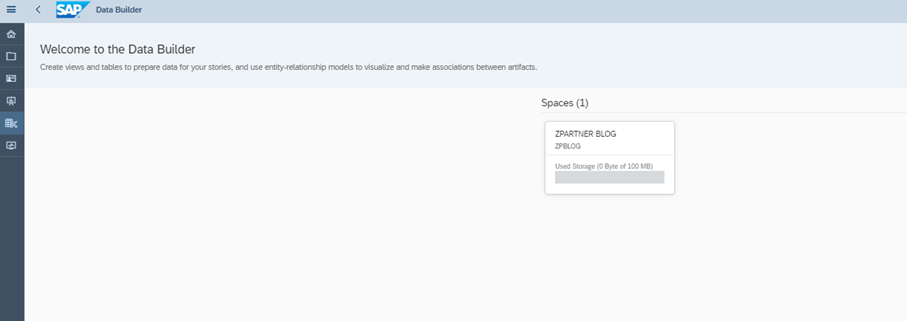
You’ll see the space that has been assigned to your user, as you remember we created a space named ZPBLOG before.
By clicking on that space, it shows various options to create a data model in SAP Data Warehouse Cloud.
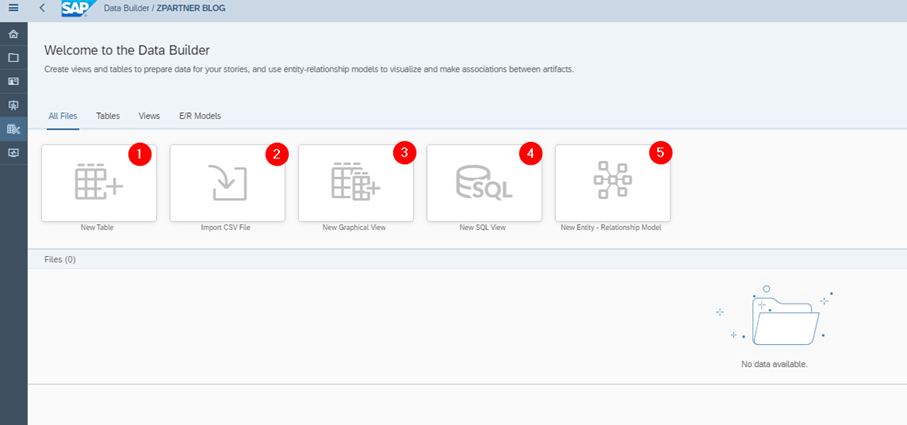
The first option is “New table”, you may create your own table from scratch by defining columns with data types like STRING, CHAR, DATE, INT, etc. those we are familiar with from various programming languages.
The second option is to import a CSV file. SAP Data Warehouse Cloud will generate automatically a table with the columns based on your CSV file.
The third option is to create a graphical view. We will use this option in our blog to create a data model. Since our data source comes from SAP BW we do not need to import any data in SAP Data Warehouse Cloud we just make a view/projection based on it.
The fourth option is to create a view based on SQL language. If you are used to work with SQL this option may be a good option for you.
The last option is E/R Model. This option is not for building a data model but more to relate a view to another view by creating semantics such as hierarchy between those views.
As described above we will create our data model with the third option. Let’s choose this and next, you will see this screen (Fig 4).
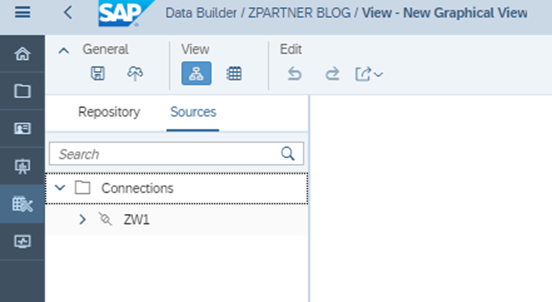
As mentioned in our first blog to connect SAP Data Warehouse Cloud with SAP on-premise systems such as SAP ERP, SAP BW, etc, data provisioning agent should be connected. Since I already set it up, it is already available as source system in the SAP Data Warehouse Cloud (in this case ZW1 as shown in Fig 4). If you open this connection, it shows the ABAP Tables available within this system in a tree structure.
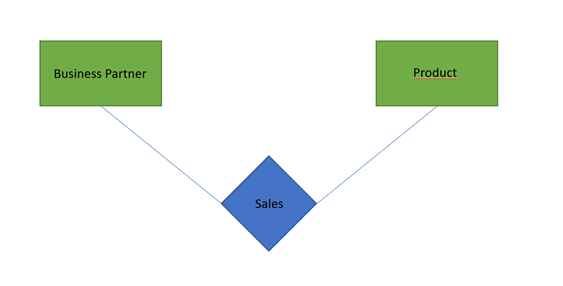
We need 3 tables to build our dashboard, the first table is business partner, the second is product and third is sales.
For these purpose, InfoProviders in SAP BW have been already prepared beforehand (Fig 6):

As you may know, SAP BW is capable to generate automatically tables and views when you create an aDSO, we will use the generated views from these 3 info providers.
/BIC/AZTRPBP007 for business partner
/BIC/AZTRPPT007 for product
/BIC/AZTRPSD007 for sales
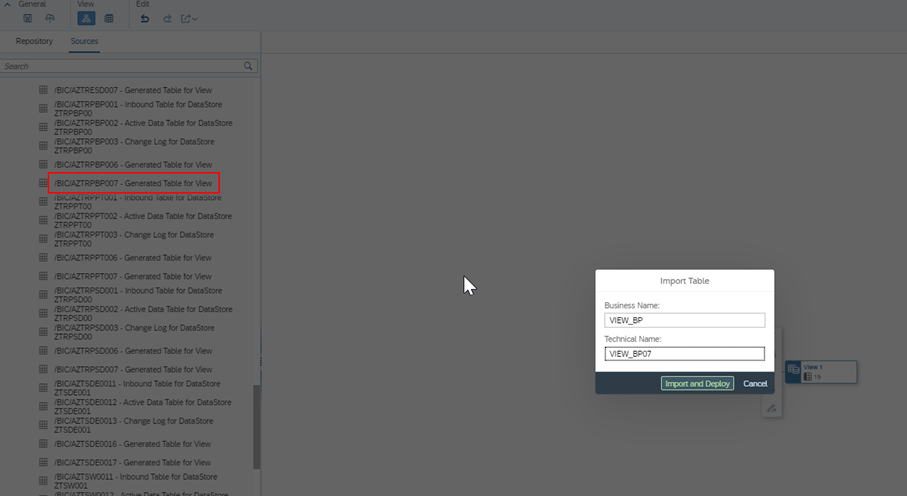
As you see on the left panel (Fig 7) you can search the tables/views mentioned above by opening the tree structure and then drag it to the design area.
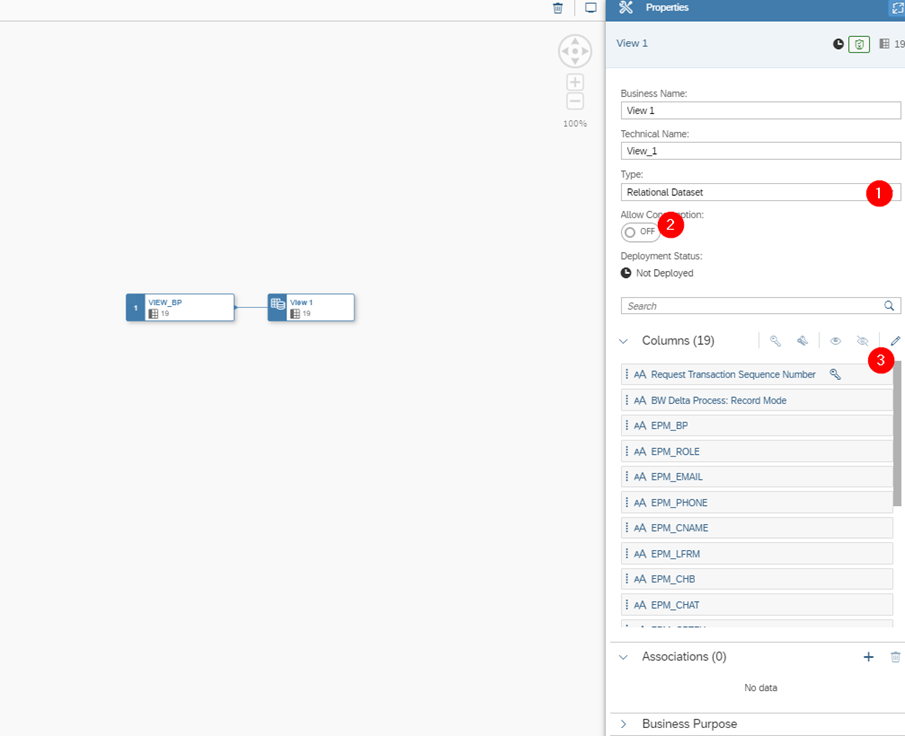
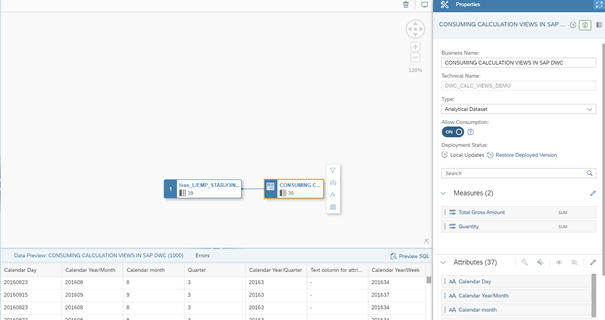
After you dragged it in to the work area(Fig 8), on the right panel you may see many parameters which can be set, for instance, you have the choice of various types the view can be used for (1): relational data set, dimension, and analytical data set.
Only analytical data set can be consumed by a dashboard/story. The view with type dimension can be used for defining hierarchy or some filter and can’t be consumed in a story. We will use this type for our business partner. Allow Consumption (2) should be activated to allow this view to be consumed to another view, and in the columns (3) you can set the key field, change the name of the column, moreover you can exclude or include the field (set as visible or hidden)
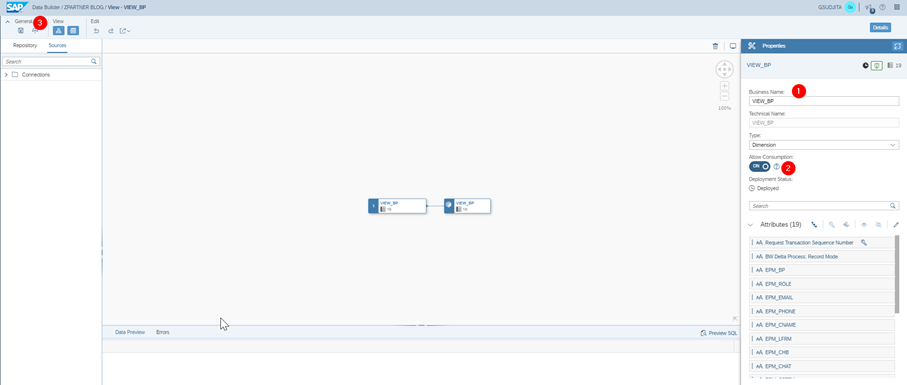
In (Fig 9) I gave this view a name VIEW_BP, switched on Allow Consumption, and lastly don’t forget to save and deploy this view so we can continue to another view.
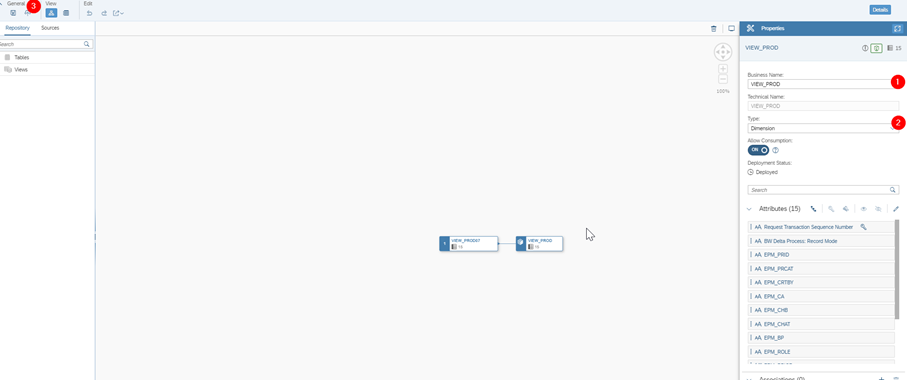
We do the same procedure as before. Another view for product must be created (Fig 10). Let’s give this view a name VIEW_PROD, type dimension, and deploy it.
The last view that we are going to create is the sales view, in this view, we will use analytical data set because we need this type to be consumed to our dashboard later.
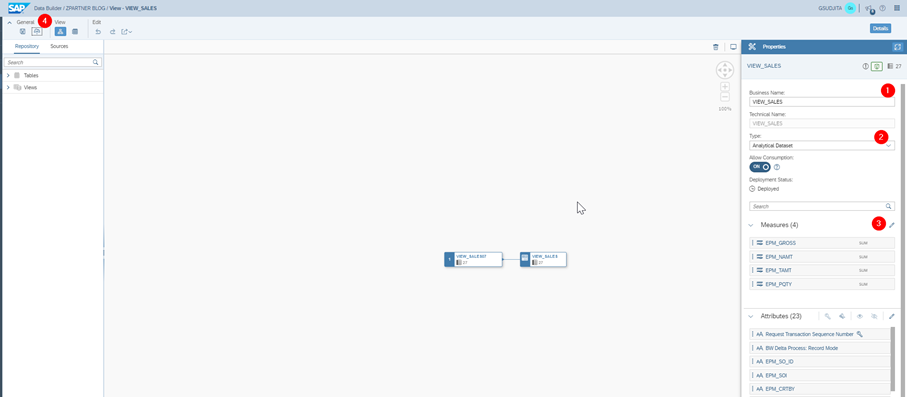
A name should be given (1) for our sales view (Fig 11). The difference here is, that analytical data sets need measures to be defined (2), measures are numerical values like net amount, quantity, etc. in our case there are four measures available: gross amount, net amount, taxes amount and quantity. These measures will be dragged to the measure’s column (3). Don’t forget to save and deploy this view (4).
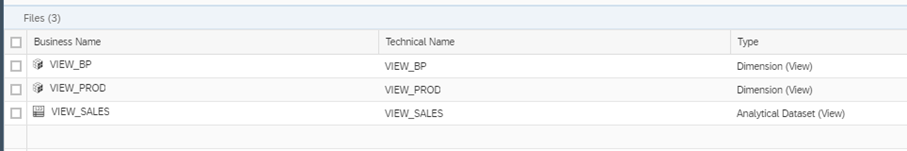
In this blog, we have created 3 views, 2 views from business partner and product, these with type “dimension”. And the last view from sales, this view uses type “analytical data” set.
Thank you for following this chapter. In the next chapter, we will dive into connecting our views to each other and do some simple filter and calculation, I hope you enjoy reading this blog and we will see you in the next chapter.
Click her for the 1st part of the Blog:
https://www.zpartner.eu/how-sap-data-warehouse-clouddwc-consumes-sap-hana-calculation-views/