Hi everyone, I hope you still follow along with our DWC blog series, today we present to you chapter 3. As a reminder in chapter 1, we have created a space, while in chapter 2 we created 3 views. And in this chapter, we will relate these 3 views together to make it as a source for our dashboard. As a starting point, let us navigate by clicking the menu data builder (see Fig 1 on the left panel).
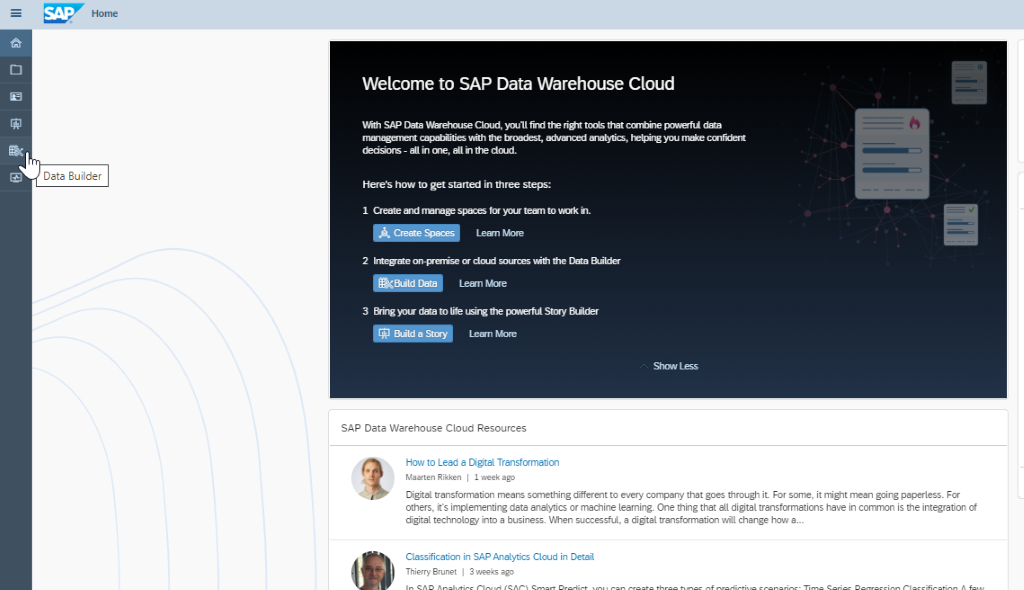
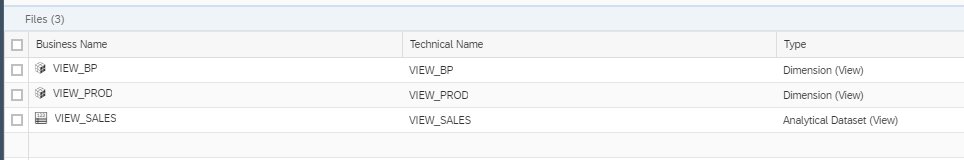
The 3 views previously created, show up (Fig 2) and you can click on “VIEW_SALES”. Because it is the only view with type analytical data set and can be consumed for building a dashboard.
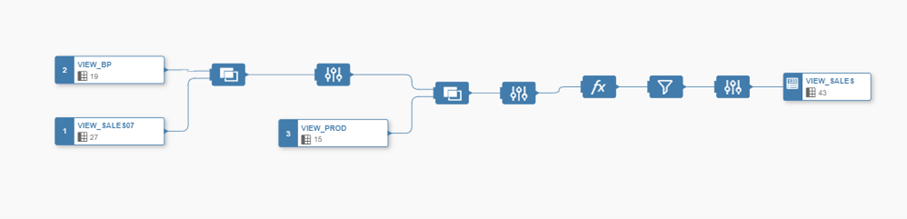
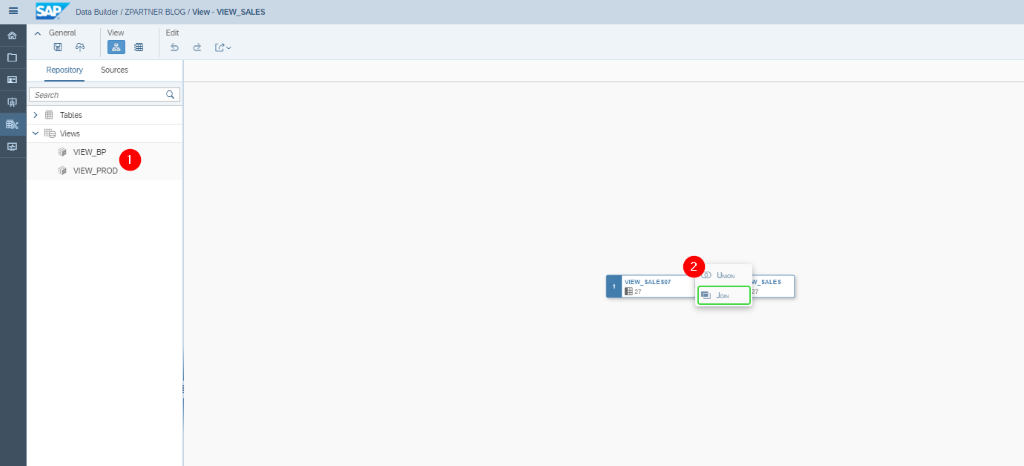
On the left panel, you see our 2 views from type Dimension (1). We must relate these views by dragging the view_bp and view_prod into view_sales until you see the pop-up option Join/Union (2). Let’s choose the option “join”.
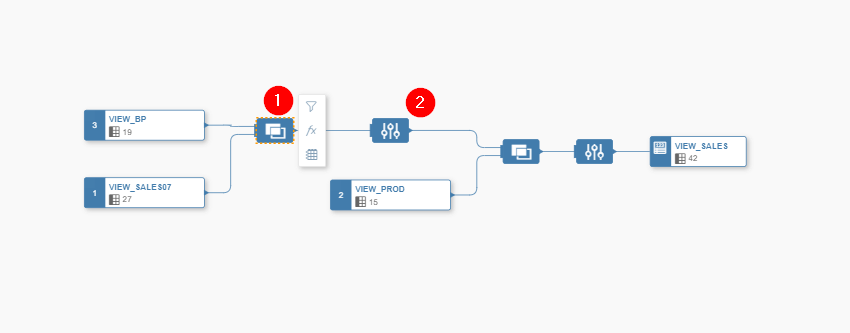
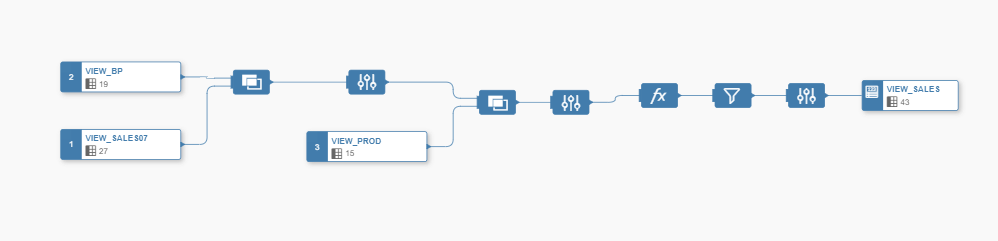
After joining those views, you will see this picture below and notice the new symbols. In the first symbol (1) you can determine the mapping between the views from which field to which field should be joined and you can choose the join type such as inner, left, right. Other options are: do a filter a calculated column
and preview from your data
.
The second symbol (2) is the output of available fields after joining. Here you can change the name of each column or set it as hidden or visible.
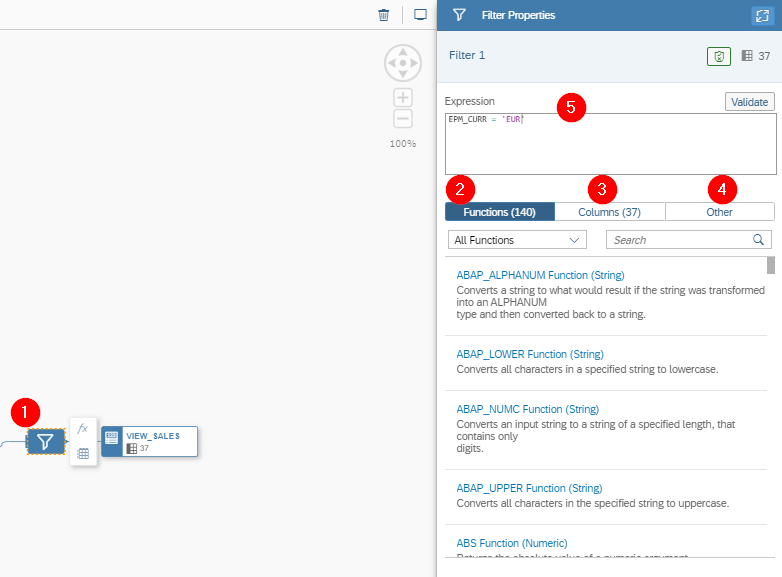
In the Fig 5 when you choose the Filter function the filter symbol (1) will occur and in the expression box you can use the standard Function (2) available from SAP Data Warehouse Cloud such as ABAP_UPPER function to make a specified string upper case or LENGTH function to return a number of characters string, and any other function. In Columns (3) is the list of our available fields in a view. Within option Other (4) you can do a basic math operation like plus, minus, multiple, and divide or you can make case expression. In our case, I created a filter to our currency code to EUR because I want to make an analysis only for the European sector (5).
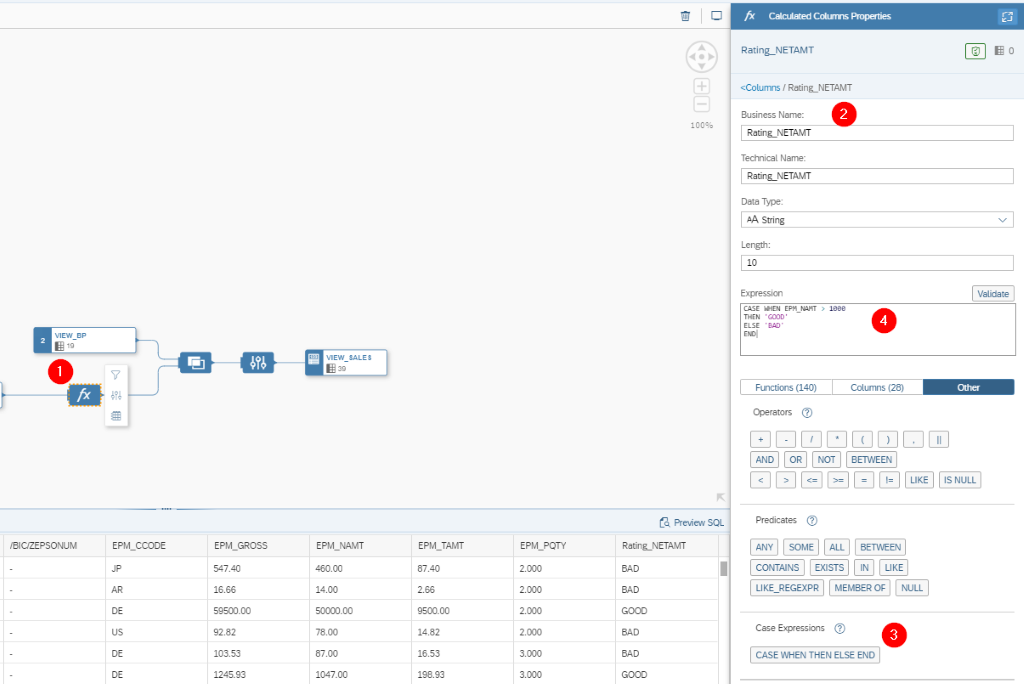
With the calculated columns (1) you can add an additional field on the fly in your view with a specified term, in the example I gave a name for the field (2) “Rating_NETAMT” and I used Case Function (3). In the expression box, I specified when the net amount has a value more than 1000 the field should give me a value “GOOD” and “BAD” when the net amount has value less than 1000. As a result, you can see in the preview data the new field “Rating_NETAMT” occurs and delivers the value according to the created term.
The result, you can see in Fig 7.
Building a dashboard will be presented in our next chapter. In this chapter, you learned how to relate views to each other, made a filter, created a calculated column with case function.
The next chapter will be the last chapter in our SAP Data Warehouse Cloud blog series, but don’t be sad because I will post regularly to tackle a special topic. Please be safe and enjoy your day.
Click her for the 1st part of the Blog:
https://www.zpartner.eu/how-sap-data-warehouse-clouddwc-consumes-sap-hana-calculation-views/
Click her for the 2nd part of our Blog:
https://www.zpartner.eu/into-the-world-of-sap-datawarehouse-cloud-series-part-2/