SAC Analytic Application – Scripting for Beginners : Part 1 How to read and change Master Data of Dimensions
When working with SAC and setting up an Analytic Application, you will probably come across scripting. If you are not an expert in Java Script, it will probably take some time until you are familiar with this script language and therewith also until you are familiar with scripting in SAC.
With a lot of searches in Google and trial and error you will reach your goal certainly. This is also how it worked out for me. This blog should help you to save some time to find the suitable solution for your challenges. I picked some standard use cases that the most implementer will come across when creating an Analytic Application.
Each part of this blog will cope with one of the cases:
- Part 1 – How-To read and change Master Data of Dimensions
- Part 2 – How-to hand over Parameters for Data Actions
- Part 3 – How-to handle and calculate Dates
- Part 4 – How-to use results from charts
In my use case, I want to create an application, where the user can enter their steps and activities they did per day and compare to other users. This will be a kind of activity challenge in the end. In this part I will shorty explain how to read and change the properties of a Dimension in SAC. This is right in the beginning needed to identify the user, which is opening the Application.
If you have an SAP BW background as I do, the requirement to get the master data of a dimension sounds rather easy. And it is even easy, if you know which objects you need to create in your Analytic Application as for example a Planning Model and if you are familiar with the syntax.
Part 1 – How-To read and change Master Data of Dimensions
First, I am going to explain how to read from the Master Data of the Dimension ‘User’. Second, I will show hot to change the Master Data of the Dimension ‘User’, but let’s start with reading.
1. Read Master Data
1.1. The Dimension ‘User’
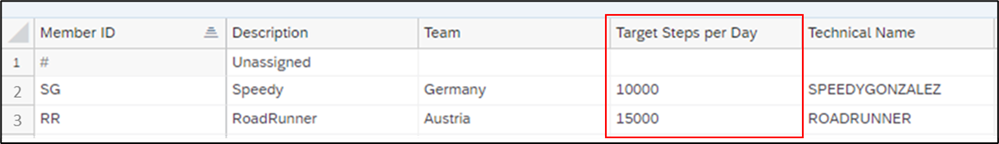
We have the Dimension ‘User’ in a Model that is used in my Analytic Application. The Dimension ‘User’ has an ID, a Description, Team, TargetSteps and Tech_Name as properties. This is how it looks like:
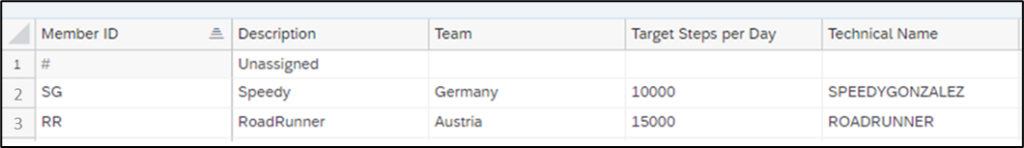
The Team is used for a Hierarchy which is called H1 and the Technical Name equals the System User.
As I know the system user of the user currently running the Analytic Application, I want to get the Member ID for this user to filter my charts on this specific user.
If Speedy Gonzalez runs my Analytic Application, I know that his System User has the Technical Name “SPEEDYGONZALEZ”, but I need the Member ID “SG” for filtering the charts. This is the string, that is needed for filtering the User in case of Speedy Gonzalez: “[User].[H1].&[SG]”.
1.2. Create a Planning Model in the Analytic Application
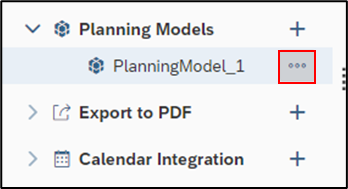
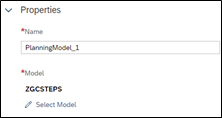
Go to the section “Planning Models” in the Outline and add a new Planning Model. Now click on the three dots on the right of the new Planning Model and enter a model which includes all relevant dimensions, where you want to read or change the properties.
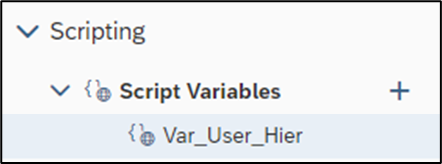
1.3. Create Variables for the User ID
Of course, we could also use a local variable in the script. However, I chose a global Variable to reuse it in Analytic Application. Once it is filled, it will have the same value during runtime.
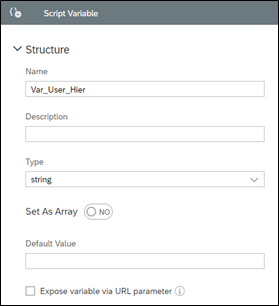
In the outline go to the section Script Variables and add a new Variable of type string
1.4. Create Script in Analytic Application
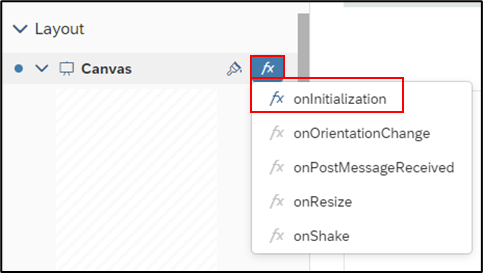
As I am filtering on the User, I want to do it right in the beginning of running the Analytic Application. To do so, I add the coding onInitialization of the Canvas.
Here, the following coding is added:
============================================================================
//get the system user
var user = Application.getUserInfo().id;
//get Properties of Dimension „User“
var g_user_prop = PlanningModel_1.getMembers(„User“);
//loop at all users, if Technical Name = System User, fill relevant Variables
for (var i=0;i<g_user_prop.length;i++){
var tech_name = g_user_prop[i].properties[„Tech_Name“];
if (tech_name === user)
{ Var_User_Hier = „[User].[H1].&[“ + g_user_prop[i].id + „]“;};};
//set the filter on User
Chart_1.getDataSource().setDimensionFilter(„User“,Var_User_Hier);
============================================================================
When initializing the Analytic Application now, the System User is taken, the respective ID is derived and the Chart_1 is filtered on the derived User.
2. Change Master Data
Now that we know how to read the Master Data, I am going to explain how to change it from the Analytic Application with the help of scripting.
Next to the ID, the description, the Team and Technical Name the Dimension also has a property which is called ‘Target Steps per Day’ (TargetSteps).
In the Analytic Application I would like to enable the user to change the number of steps, which is saved there, on their own. To do so, the Planning Model as introduced in 1.2. is reused again.
2.1. Popup
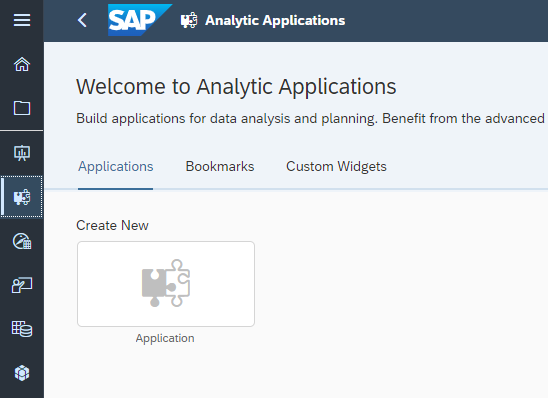
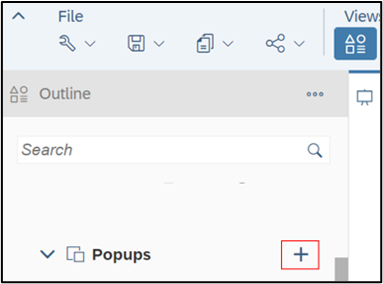
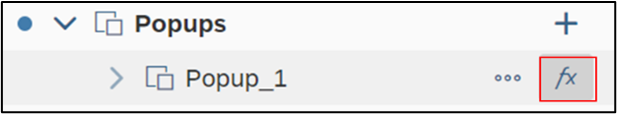
A new Popup can be created by clicking on the Plus symbol right next to “Popups” in the Outline.
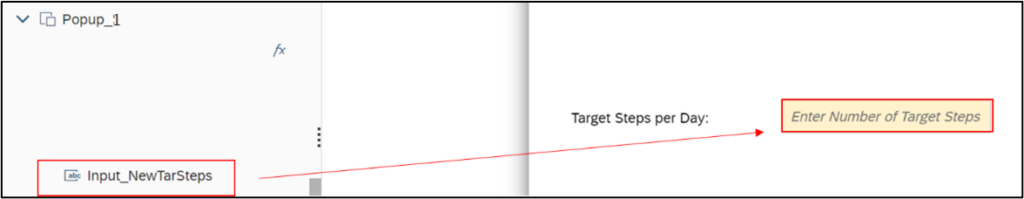
On the Popup, I added an InputField which is called Input_ NewTarSteps.
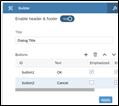
I also enable the Buttons ‘OK’ and ‘Cancel’ on the Popup.
2.2. Create Script in Analytic Application
I want the Target Steps, that are entered in the Input Field to be saved, when the user clicks on ‘OK’ in the Popup.
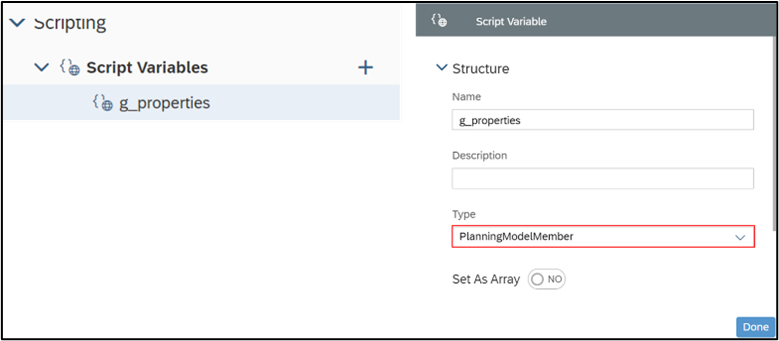
Before adding the script, I also created a variable, which is called g_properties and which is of type ‘PlanningModelMember’.
Now, I add the coding as OnClick for the Popup.
============================================================================
//only execute script if the user clicks on OK
if ( buttonId === „button1“ ) {
//save new target steps to Dimension User Properties
var target_steps = Input_NewTarSteps.getValue();
g_properties=({id:Var_UserID,properties:{TargetSteps:target_steps}});
PlanningModel_1.updateMembers(„User“,g_properties);
Popup_1.close();};
============================================================================
If the user enters Target Steps in the Input Field and presses the OK button, the Dimension ‘User’ will be updated in the background.
Now I can easily filter the Charts and Input Fields in my Application to enable the user to enter his/her steps and activities and to set user relevant information as for example the target steps for themselves.
In the next part I will shortly explain how to hand over parameters from an application to a Data Action. Stay tuned!