BPC Live Planning with SAP Analytics Cloud
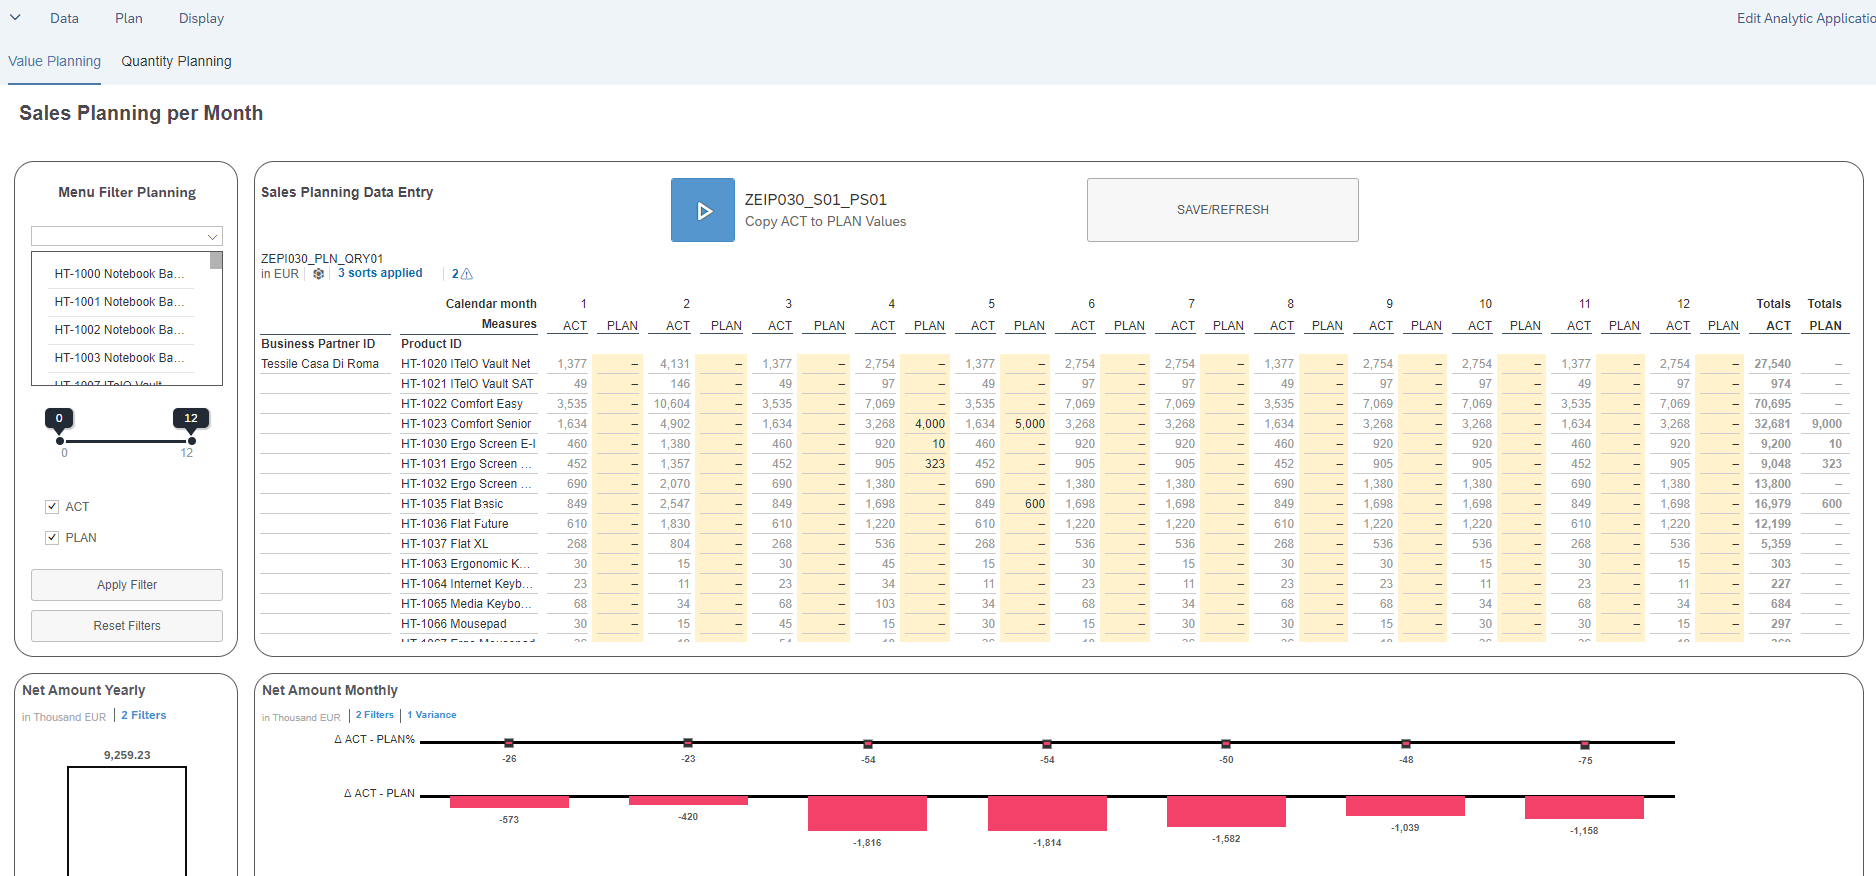
BPC Live Planning with SAP Analytics Cloud Introduction SAP Analytics Cloud offers, besides analyzing data, the option to build a planning model […]
BPC Live Planning with SAP Analytics Cloud Introduction SAP Analytics Cloud offers, besides analyzing data, the option to build a planning model […]
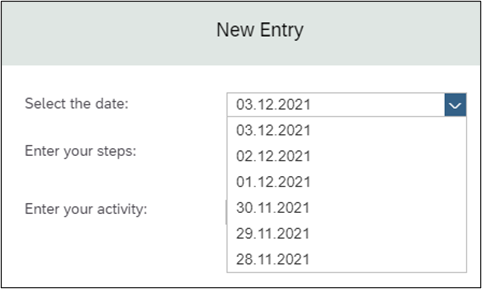
SAC Analytic Application – Scripting for Beginners : Part 3 – How-to handle and calculate Dates In the first part of this […]
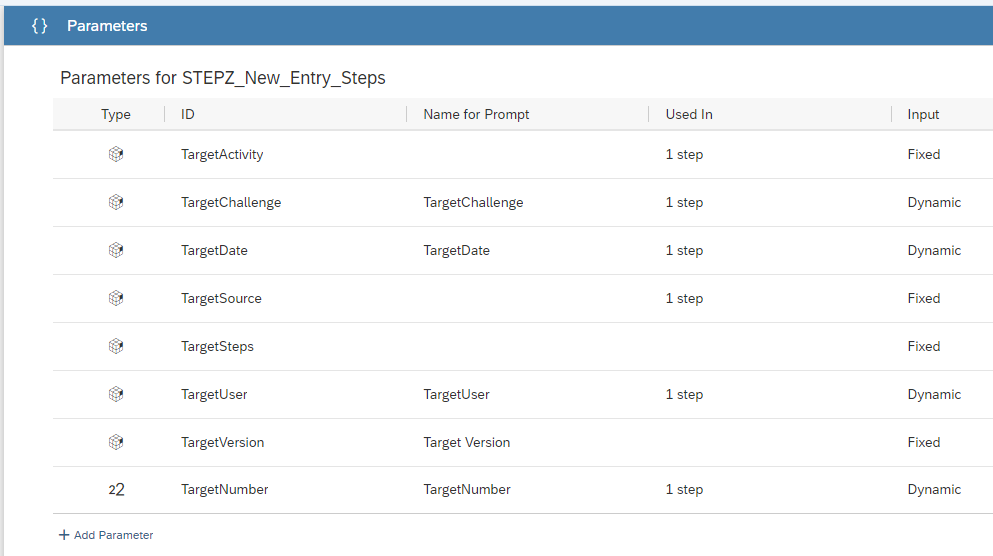
SAC Analytic Application – Scripting for Beginners : Part 2 – How-to hand over Parameters for Data Actions In the first part […]
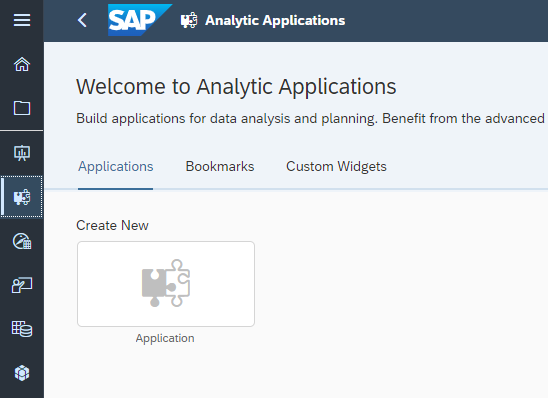
SAC Analytic Application – Scripting for Beginners : Part 1 How to read and change Master Data of Dimensions When working with […]
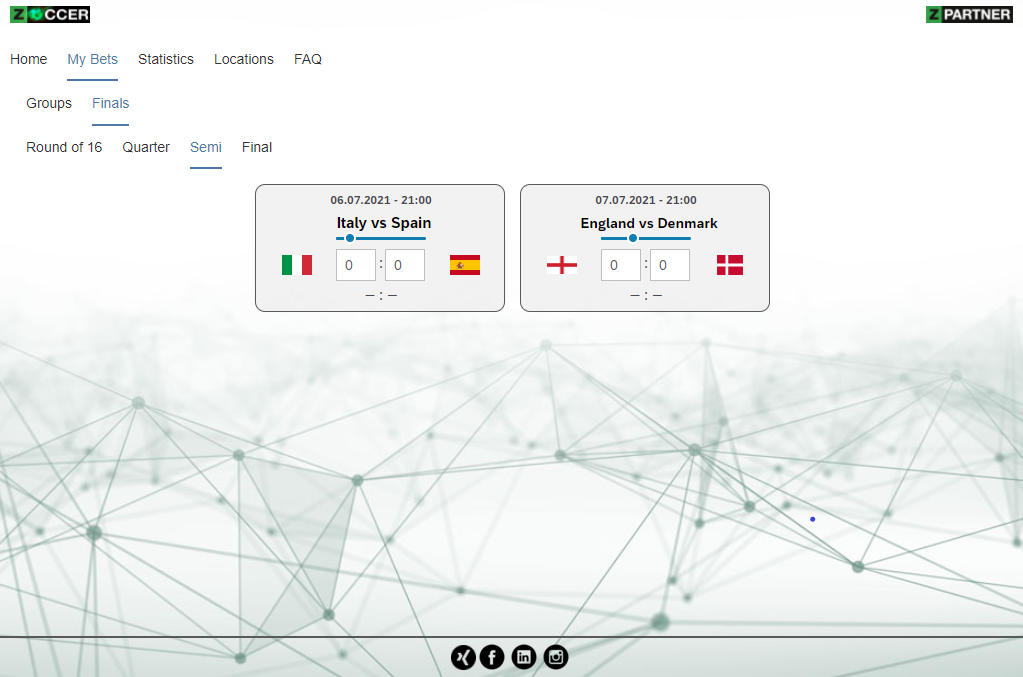
Es bleibt spannend! Nach sehr torreichen Achtel- und Viertelfinalspielen starten morgen die Halbfinale der ⚽ EM 2021. Um die SAP Analytics Cloud […]
Introduction This How-to Paper provides guidance for an end-user on which settings/changes are necessary to make a new/existing SAP Analytics Cloud Story […]
BPC Live Planung mit SAP Analytics Cloud Einleitung Die SAP Analytics Cloud bietet neben der Analyse von Daten auch die Möglichkeit in der SAC […]
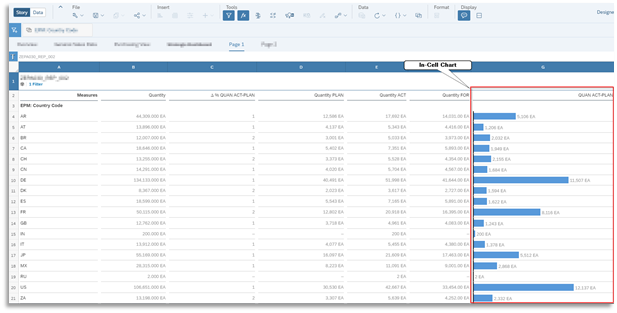
Introduction This How-to Paper provides guidance on how to display a deviation in a table in the SAP Analytics Cloud in conformity […]