SAC Analytic Application – Scripting for Beginners : Part 4 – How-to use results from charts
In the first part of this SAC Scripting blog series, I shorty explained how Master Data can be read and changed in SAC Analytic Application with the help of scripting. In the second part, I showed how Data Actions can be used in Analytic Application and how parameters can be dynamically defined and handed over to the data action. In third part, I explained how dates can be handled in scripting. Finally, in this part I will shortly explain, how results from charts can be reused in an application, for example by creating awards.
I am creating an Analytic Application, where users can enter their steps and activities to compete. This means, there is also a user who is in the lead, and I want to further motivate and reward them by showing a popup when the user takes the lead. To do so, there are several steps and objects needed:
- A chart, that shows who is currently in the lead
- Different variables, which define the leading status and include the correct text for the leader
- The popup, which is displayed, when the user takes over the lead
- The script, which analyses the chart with the leader and then displays the popup
Let’s take a closer look at the single steps and objects.
1. Hidden Chart Top 2 User
To find out, who is currently in the lead, I add a hidden chart on the main page, which only includes the top 2 users. We need the top 2 users and not only the top user as I will also inform the leader, how many steps he/she is in front to the runner-up.
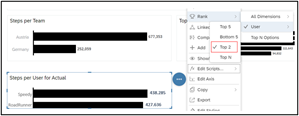
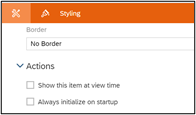
The chart is hidden and, in the styling, the flag ‘Show this item at view time’ is not set.
2. Create new variables
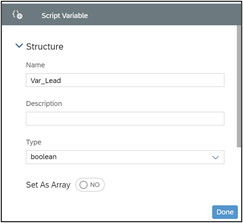
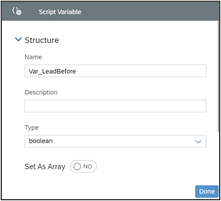
To correctly award the user, when he/she is in the lead after entering or changing steps, I will create some new variables with the type ‘Boolean’. I create two variables to be able to decide, whether the user is newly in the lead or if he/she was in the lead before.
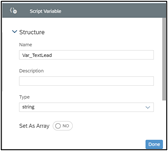
In the Popup, that will be displayed to the user, there will also be a text shown, that tells the user how many steps he/she is in front to the runner-up. To create this information dynamically, I create a string variable, that will be filled in the coding for this case.
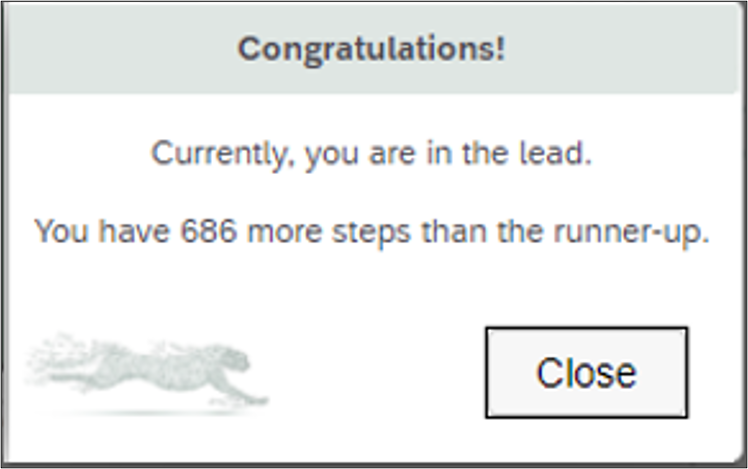
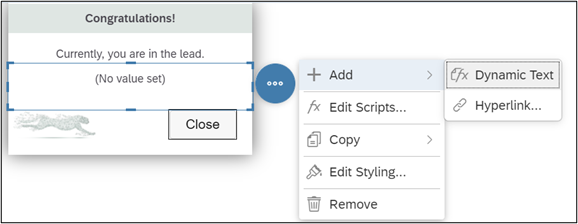
3. Create the Popup for the Leader
Now, I will create the Popup, that will be displayed, if one user jumped to the first place of the user ranking after a new entry or a changed entry. This Popup mainly consists of two text fields (header and lower text field), an image and the ‘Close’ button. The ‘Close’ Button only has the following coding as the onClick scripting:
Popup_Lead.close();
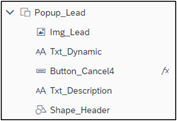
This is how the Popup looks in the Edit-Mode
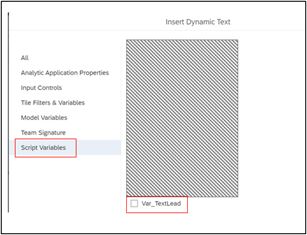
In the lower text field, I added the Variable ‘Var_LeadText, which will be filled with the correct text in the coding. The variable can be added in the text by clicking on the three dots on the right side, then on ‘Add’ and then select the ‘Dynamic Text’. On the right side, ‘Script Variables’ can be selected and here you have all available String variables that can be used. In this case, I will select Var_LeadText.
4. Script
4.1 Method Awards.LeadAward
In this coding, the hidden chart ‘Chart.Lead’ from chapter 1 is analyzed. This is done by checking, if the top user from the chart is the same as the user logged in. If this is the case, the Variable Var_Lead is set to true, which is again relevant for 4.2, and the steps from the runner-up are checked to calculate the difference and to fill the text variable Var_LeadText.
***
var sel = Chart_Lead.getDataSource().getResultSet();
if (sel.length>0){var selection = sel[0];
for (var dimensionId in selection){
var memberId = selection[dimensionId];
if (dimensionId === „User“ && memberId.id === Var_User_Hier){
Var_Lead = true;
var lead = true;}}};
//now fill the text for the leader to show how much more steps he/she has in front of the second
if ( lead = true ){
for ( dimensionId in selection){
memberId = selection[dimensionId];
var steps_lead = ConvertUtils.stringToInteger( sel[0][‚@MeasureDimension‘].rawValue );
if (sel.length>1){
var steps_second = ConvertUtils.stringToInteger( sel[1][‚@MeasureDimension‘].rawValue );}
else {steps_second = 0;}
var difference = steps_lead – steps_second;
};
Var_TextLead = „You have “ + ConvertUtils.numberToString(difference) + “ more steps than the runner-up.“;};
***
4.2 Method Awards.GiveAwards
This is the method, which will be always used, when a new Entry was done or when an entry was changed. Here, it is checked, if the user was in the lead before the entry/change or if he/she is newly in the lead. To do so, the method Awards.LeadAward (4.1) is used and if the status changed from not in the lead to in the lead for the user, the popup (3) is shown.
***
//save the current state of awards to track changes
Var_LeadBefore = Var_Lead;
Var_Lead = false;
//now see which awards are given
Awards.LeadAward();
//state popup when there is a change
if (Var_LeadBefore === false && Var_Lead === true ) {
Popup_Lead.open();};
***
5. Example
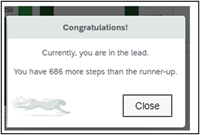
In this example, the user ‘Road Runner’ is on the second place when running the application.
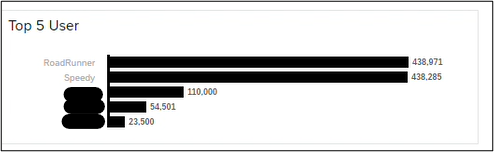
Then he enters 10.000 steps and 15 minutes Yoga. He overtook Speedy Gonzales and now Road Runner is in the lead and the Popup is displayed.
In the ranking, we can see that Road Runner is exactly 686 steps before Speedy Gonzales.
In this part, I shortly showed, how scripting in an Analytic Application can be used to implement a small reward system for the user.
I hope that this blog series simplified the first steps with the Analytic Application and scripting as little bit and gives an overview how common use cases could be implemented in SAC for example.