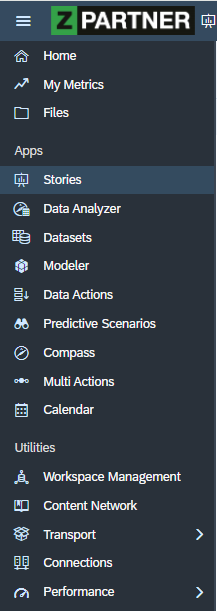
SAP Analytics Cloud Q4 2025 – New Features: Composites, Variance Scripting, new KPI Widget, Live Versions, Performance Stats.
With the new Q4 2025 release of SAP Analytics Cloud, the first impression changes noticeably due to the switch from the Belize theme to the Horizon theme as the new default appearance. In your personal settings, you can also enable high-contrast versions of both the light and dark variants. Next year, SAP plans to allow the Horizon theme to be used directly inside stories as well.
In contrast to the visual updates, this blog focuses primarily on the technical enhancements.

1. Composites
What Composites are – and why they matter
Composites are reusable UI objects that bundle widgets, data bindings, styling, and scripts into a single asset you can use in any Optimized Story Experience canvas. Think corporate headers, footers, navigation panels, filterspluschart clusters, or a scripted “chart/table switcher”—all governed once and reused everywhere.
Restrictions: Composites are currently supported on canvas pages in OSE; check the restrictions list.
Composite – Automatic Exposure of Script Object Functions for Reuse Across Multiple Stories
SAP recently introduced a feature that allows automatic exposure of custom script object functions as reusable interface functions inside a composite.
This means you can now share and reuse script logic across multiple stories — without manually copying or duplicating code every time.
In other words, script objects defined inside a composite can be exposed as part of its public API and accessed directly by other stories consuming that composite.
Quick Example
Let us walk through a simple case:
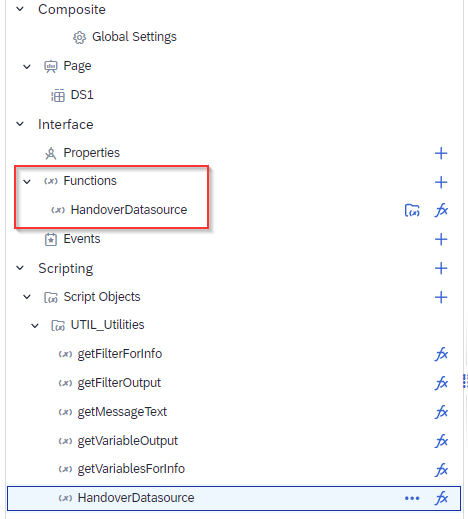
We will use a method that receives a Data Source as an argument and returns a string describing the name before and after the change.
There is now a new toggle on the Script Object that, when activated, exposes the method in the Function tab:

There is now a new toggle on the Script Object which will, when activated bring up the method on in the function tab:
After enabling this, you need to:
1. Import the composite into your story.
2. Add it to your canvas to access the composite functions.
My take: This isn’t entirely new — similar functionality existed in older SAC versions. Ideally, it should be possible to access global reusable functions simply by importing the composite (without having to place it on the canvas).
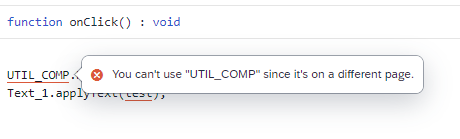
Also, when working with multi-page stories, you currently need to add the composite on each page, since cross-page access isn’t supported yet.
Composite – Where used functionality
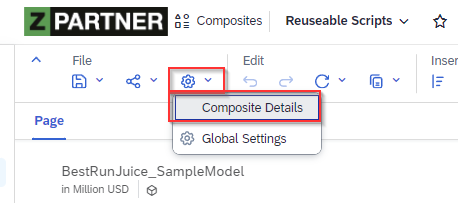
SAP has also introduced a “Where Used” feature for composites — a simple but welcome enhancement.
While in Edit Mode, open the Composite Settings to access this functionality.
It helps identify which stories are using a given composite, improving transparency and impact analysis before making changes.
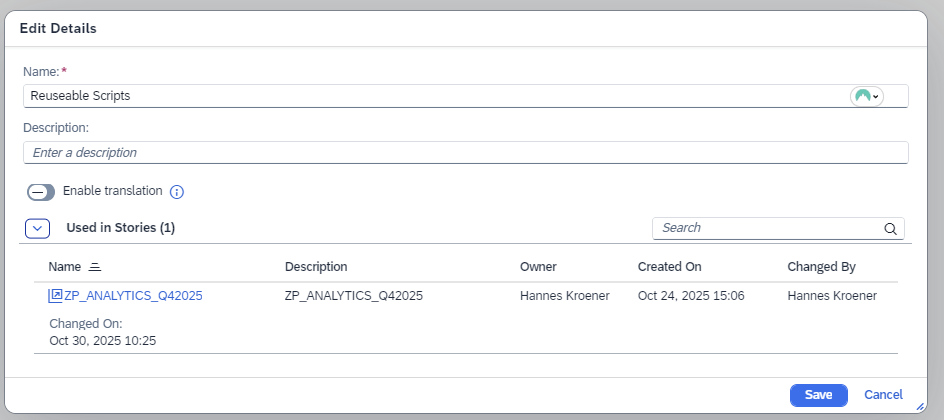
Unfortunately, I couldn’t yet find a way to extract a complete list of composites and their story dependencies in one consolidated table — even within SAP Content Models. That’s still a gap I’d love to see filled.
Additionally, we now can also use Datasphere models within a composite.

2. Variance scripting (optimized stories)
What It’s For
Product owners and analysts often need robust variance logic — whether it’s Period over Period (PoP), Year over Year (YoY), or Version-to-Version comparisons.
And crucially, it has to respect the viewer’s current filters (time, version, product, etc.).
With this new enhancement in SAP Analytics Cloud, you now gain the flexibility to set variances dynamically — no more creating multiple charts for each scenario or managing complex visibility rules.
How It Works
The function getVariances() gives you access to all variances already applied to a chart widget.
By extending it with a bit of scripting, you can switch dynamically to another measure or time interval for your variance comparison.
Quick example
// Switch the input control to a different measure

InputControl_1.getInputControlDataSource().setSelectedMembers("[Account_BestRunJ_sold].[parentId].&[Quantity_sold]");

// Retrieve existing variances

var variance = Chart_1.getVariance().getVariances();

// Adjust the source and target measures

variance[0].setSourceMeasure("[Account_BestRunJ_sold].[parentId].&[Quantity_sold]");

variance[0].setTargetMeasure("[Account_BestRunJ_sold].[parentId].&[Quantity_sold]");

// Compare against previous year

variance[0].setTargetTimeInterval("Date_703i1904sd", VarianceTime.PreviousYear);

// Update the variance configuration

Chart_1.getVariance().updateVariance(variance[0]);
This simple script lets you adjust your variance dynamically, directly in the story — without duplicating charts or creating new widgets.
Powerful Variance API
The Variance object provides a rich set of methods to fine-tune everything you’d normally configure in the story editor — now programmable through scripting.
You can control not only the measures and time intervals, but also display options, labels, and aggregation logic.
Reference Documentation:
Variance API Reference (Help Portal)
SAP Analytics Cloud Variance Methods Overview
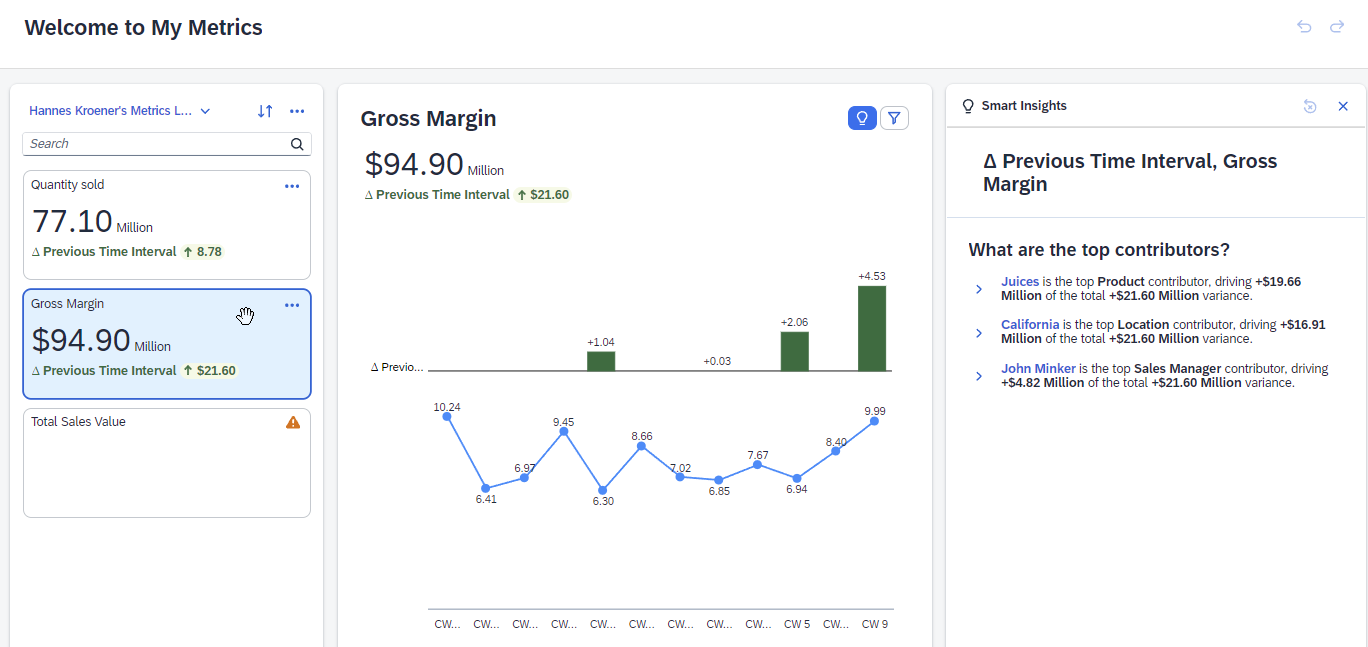
3. My Metrics for KPIs ( formerly Watchlist )
Your Personalized KPI Command Center
The new My Metrics feature in SAP Analytics Cloud brings KPI tracking right to your fingertips.
It allows you to add, monitor, and manage your most important KPIs in the form of compact, interactive tiles — which can even be displayed directly on your Home screen.
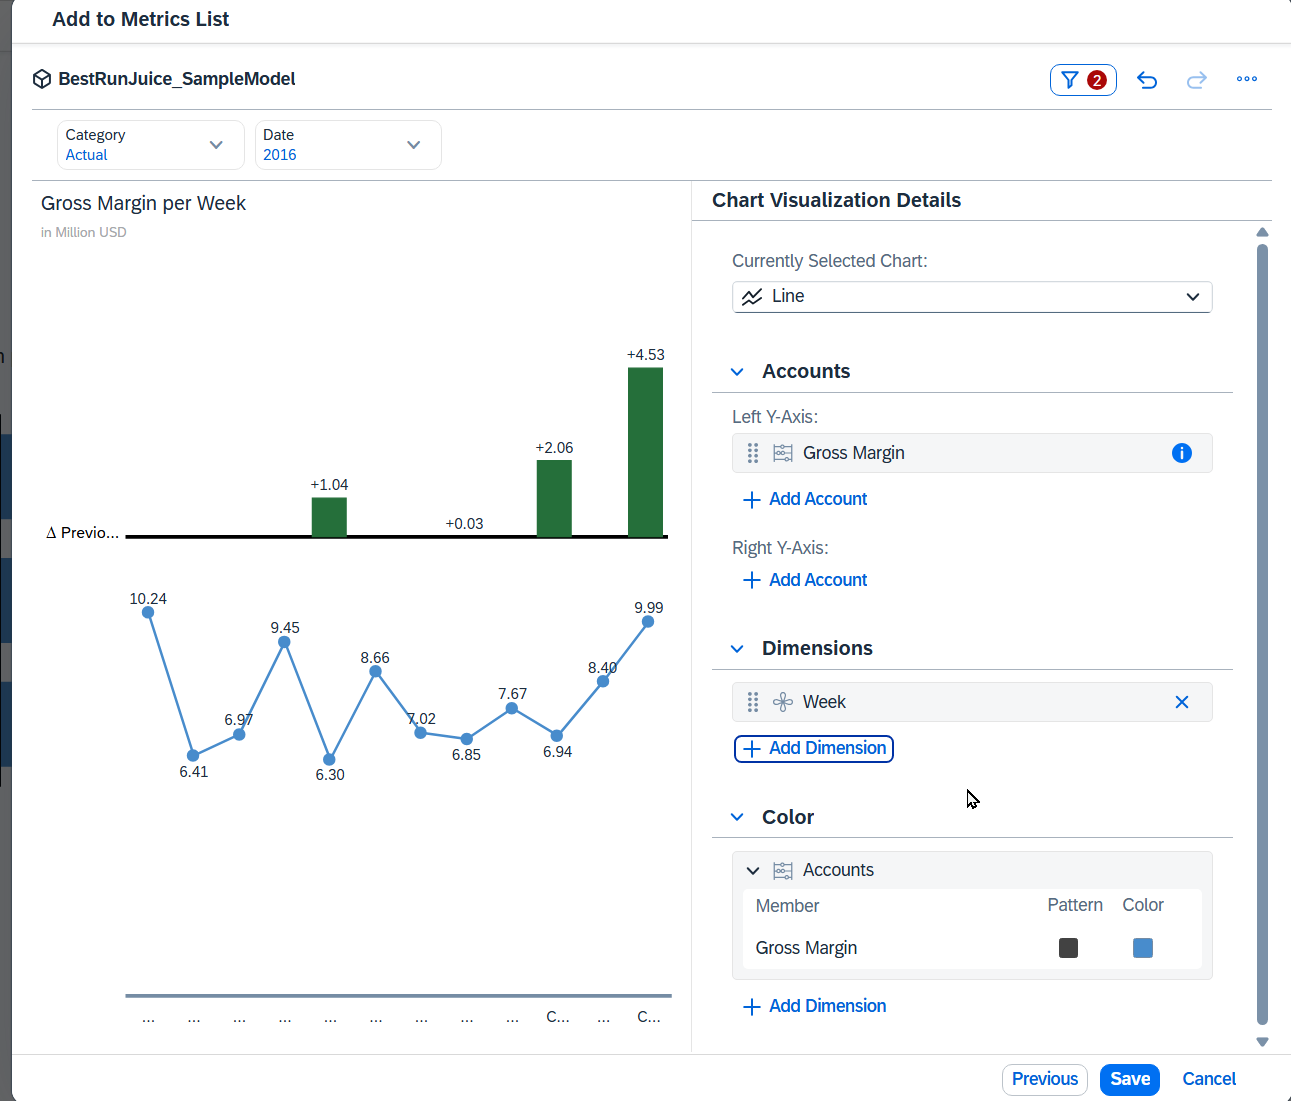
Each metric tile provides a quick snapshot of performance, but the real magic happens when you click into it.
You’ll see:
- A detailed visualization (for example, a line chart showing trends over time)
- A Smart Insights panel, powered by the Just Ask engine, automatically generating contextual insights about your data
Together, these panes give you both the big picture and the deeper story behind your numbers.
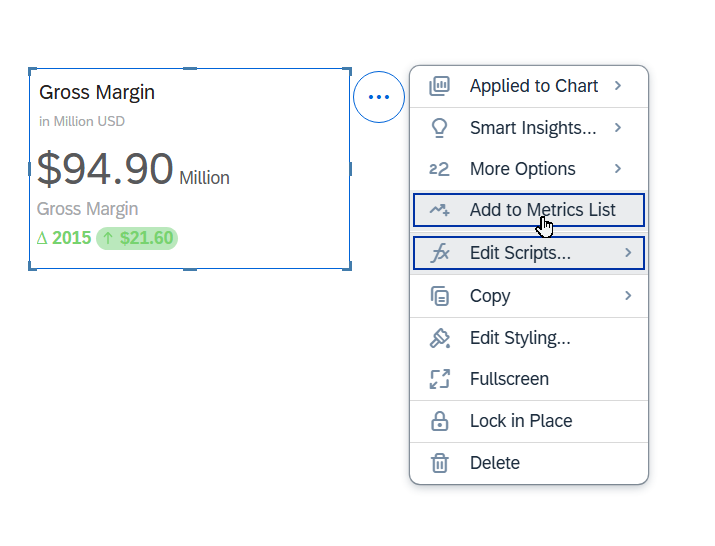
Adding and Managing Metrics
Adding a new measure to your Metrics List is simple:
1. Open a chart (note: currently, metrics can’t be added from tables).
2. Choose “Add to My Metrics” to pin that measure to your personal list.
You can also enrich your metric tiles with variances, comparisons, or reference lines, which give you instant clarity on direction and trend — not just raw numbers.
Once created, your metric list can be shared with colleagues, making it easy to align on key goals and indicators across teams.
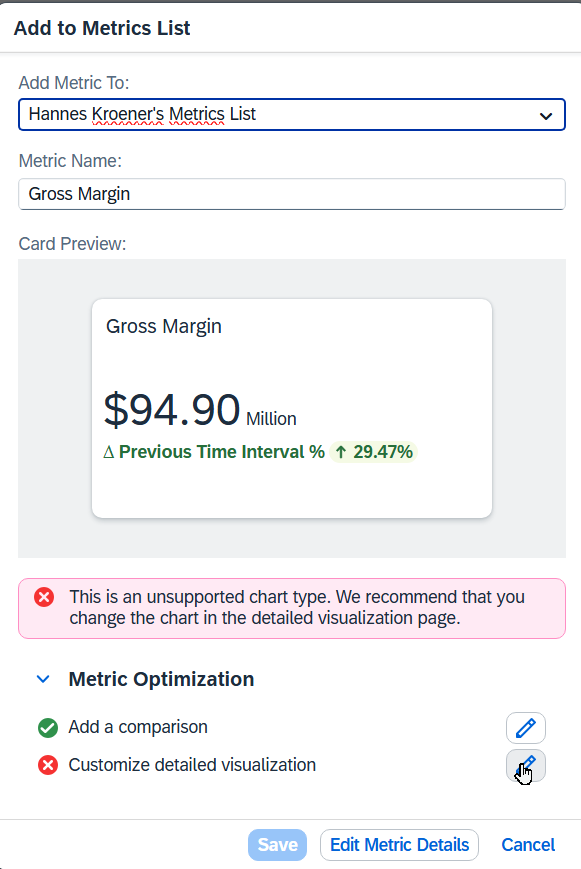

What’s Coming Next
SAP plans to take this feature further:
Metric Subscriptions. In an upcoming release, you’ll be able to subscribe to your favorite metrics — receiving email alerts whenever one of them changes.
Metric Optimization. You’ll also get more options to customize the presentation of each metric’s detailed view, fine-tuning how it’s visualized and contextualized.
Together, these improvements will turn My Metrics into a lightweight yet powerful KPI dashboard that combines personal tracking, smart insights, and proactive alerts.
5. Seamless Planning Live Versions
The latest step in SAP’s seamless planning journey brings “live versions” into play — connecting SAP Datasphere directly with SAP Analytics Cloud (SAC) for planning. Instead of importing or replicating data, planners can now work with real-time actuals and drivers straight from Datasphere as part of their planning model. This means no more nightly upload jobs or duplicated data layers — just one consistent version of truth for analytics and planning alike. For business users, it translates into faster decisions based on always-up-to-date numbers.
For developers and data teams, it reduces data movement, maintenance, and reconciliation work. In short, this feature closes the long-standing gap between data governance and agile planning, giving organizations a more scalable foundation for integrated, cross-domain planning across finance, operations, and beyond. It’s not just a technical enhancement — it’s a structural shift toward real-time, enterprise-wide planning in the SAP Business Data Cloud era.
Quick Look
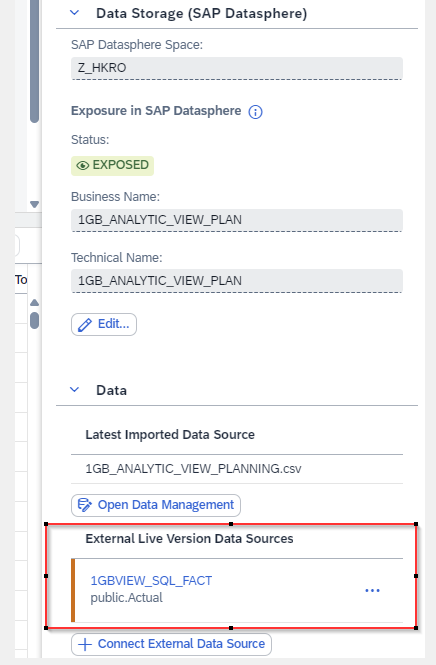
Go to your Seamless Planning Model and add an external live version model from Datasphere in the details view. Map your columns and measures to the Model and that’s already it
Within the data preview, you can already see the two different versions available.
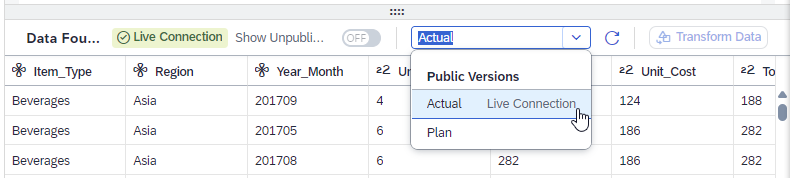
Now you can display both versions in any tables or charts within your planning application, but you can also use it as a reference in data actions and advanced formulas.
For a detailed step by step process check out the following communication from SAP:
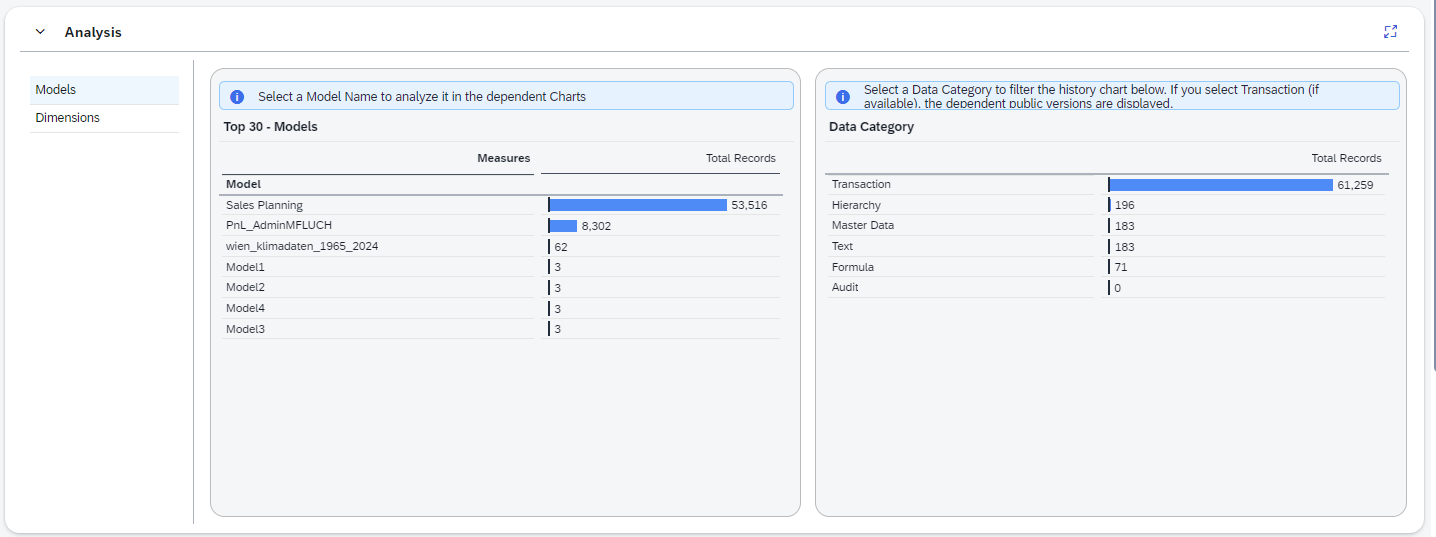
6. Model Size Statistics and Analysis
This admin story supports system housekeeping for import models.
The Key KPI section highlights important model characteristics.
The Analysis view shows total records per model and data category.
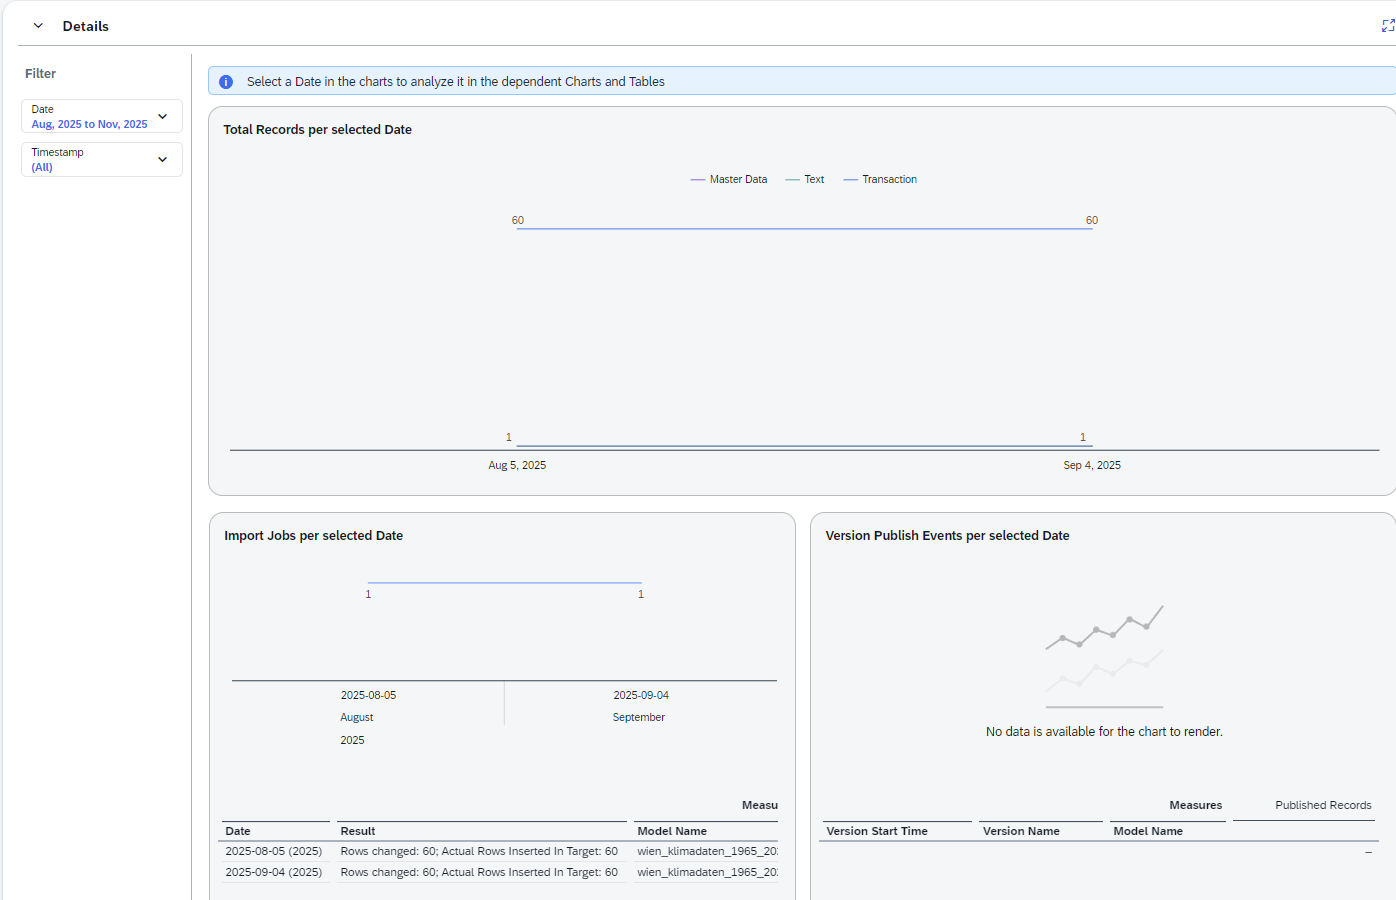
In the Details view, you can track record growth by date and review information about your import jobs.
Key KPI Section

Analysis view
Details view
Author: Hannes Kröner
Hannes is a seasoned SAP professional with more than a decade of hands-on experience across the SAP ecosystem, including over five years working deeply with SAP Data Intelligence and architecting high-performance reporting solutions in SAP Analytics Cloud. He is recognized for his ability to design and optimize large-scale analytical scenarios, build performant SAC stories, and deliver KPI-driven dashboards capable of handling complex business requirements and massive data volumes.