Next to most current and correct data, performance is another very important factor in analytics. In the blog „How to trace widgets in SAP Analytics Cloud stories connected via HANA Live Data Connection“ ( https://blogs.sap.com/2020/02/24/how-to-trace-widgets-in-sap-analytics-cloud-stories-connected-via-hana-live-data-connection/ ) it was already described how to grep performance data and link them to a widget in a SAP Analytics Cloud Story with SAP HANA Live Connection. This analysis was done on browser frontend side.
In this blog, it is described how to capture the performance data in backend. Further a concept will be described how to use this data for a cache warmer for a SAP Analytics Cloud Story with SAP HANA Live Connection.
In case you want to improve performance of a certain story, for certain users or simply for calls exceeding a certain runtime the described concept can be an option for you.
Capture Hana Live Connection Performance in Backend
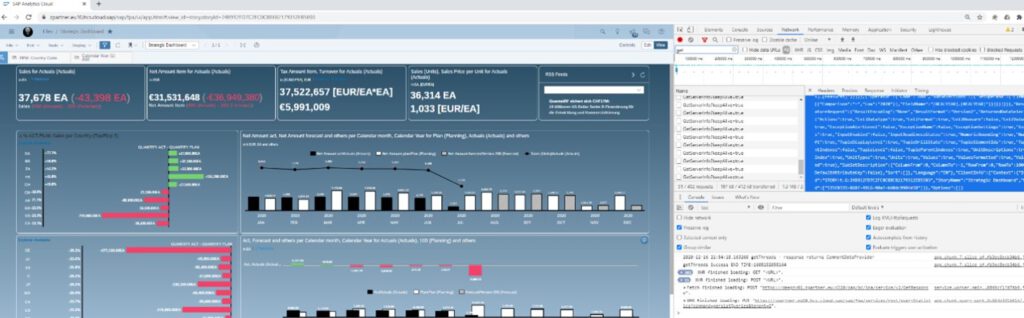
When a story is executed in SAP Analytics Cloud MDS statements are executed through the backend stack in case of Live Data Connections. In SAP Analytics Cloud these statements can be analyzed with the help of Google Development Tools.
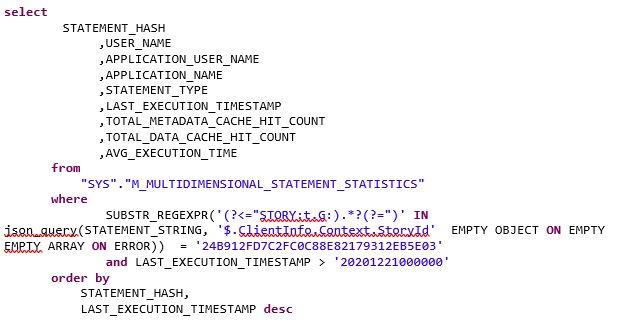
In backend the same statements can be found by accessing database view „SYS“.“M_MULTIDIMENSIONAL_STATEMENT_STATISTICS“ via SQL.
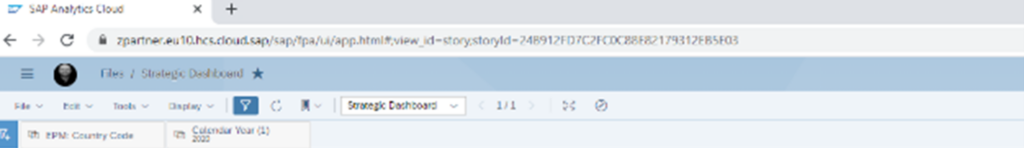
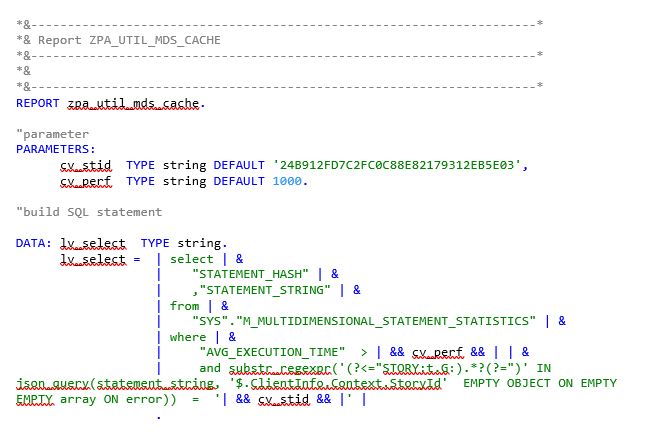
The following SQL is accessing „SYS“.“M_MULTIDIMENSIONAL_STATEMENT_STATISTICS“. and restricting result set to a specific story with id 24B912FD7C2FC0C88E82179312EB5E03.
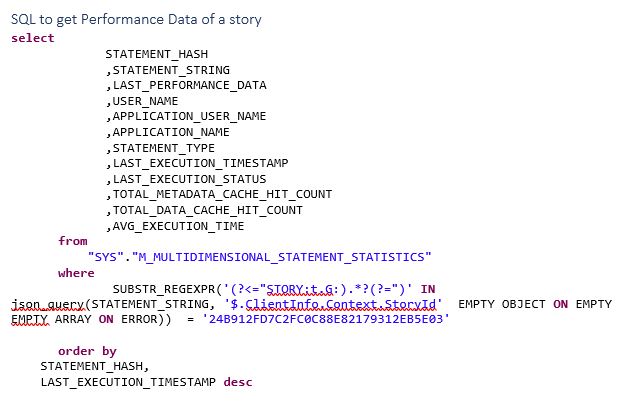
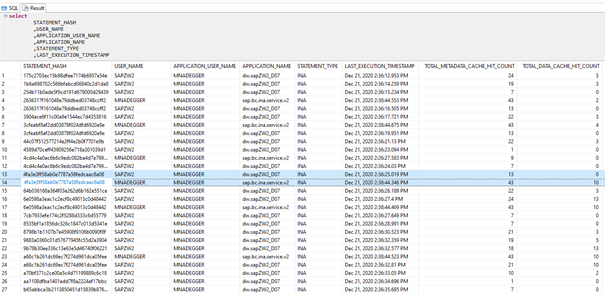
The result of the SQL delivers performance data of the last MDS call in column LAST_PERFORMANCE_DATA in JSON format. Further the executed MDS by SAP Analytics Cloud can be retrieved in column STATEMENT_STRING.
The column STATEMENT_HASH represents a HASH value generated out of the STATEMENT_STRING and marks equal statements.
AVG_EXECUTION_TIME is showing the average execution time of a statement and can also be used as a performance indicator for the statement.
With the help of this SQL we are able to identify bad performing MDS calls out of SAP Analytics Cloud. In addition, we can extract their MDS statements causing this.
Execute MDS via ABAP
In SAP Note 2550833 (https://launchpad.support.sap.com/#/notes/2550833) it is described how to execute MDS statements by using EXECUTE_MDS via an SQL interface and what you have to keep in mind when doing this. Calling a MDS statement will also lead to warm the cache for the executed statement. A manual way to warm the cache for a specific MDS statement would be to extract the statement as described out of view „SYS“.“M_MULTIDIMENSIONAL_STATEMENT_STATISTICS“ and execute them in SQL interface via EXECUTE_MDS.
With the help of a custom ABAP report named ZPA_UTIL_MDS_CACHE such “Cache Warming” can also be done on regular bases and also triggered by certain events like data loads. Cache warming could be scheduled with the help of SAP BW process chains and integrated in daily process.
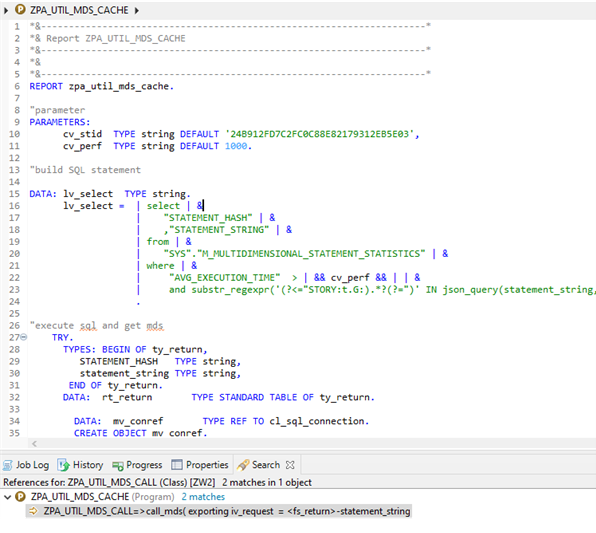
ABAP Implementation
The following coding enables you to execute all MDS statements that are lasting longer than a defined average performance. The reports act now like a MDS caller, fed by performance data statements out of view „SYS“.“M_MULTIDIMENSIONAL_STATEMENT_STATISTICS“.
One very important remark on that point is that there is a size limit ok 65KB accessing column STATEMENT_STRING via ABAP. As a matter of fact statements over this limit are not complete and won’t be executed correctly.
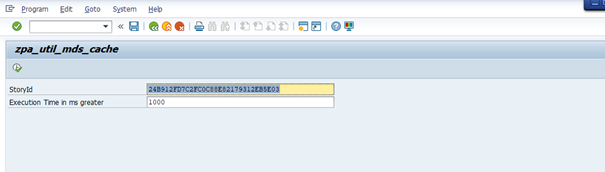
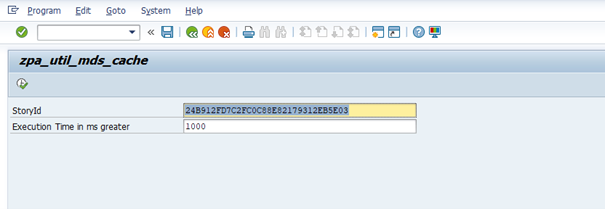
In our case we execute all MDS statements of a story with id “24B912FD7C2FC0C88E82179312EB5E03” having an avg performance over 1000 milliseconds parameterized with the help of the 2 parameters in initial screen.
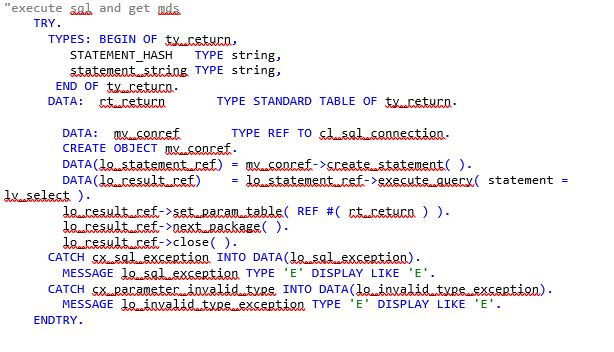
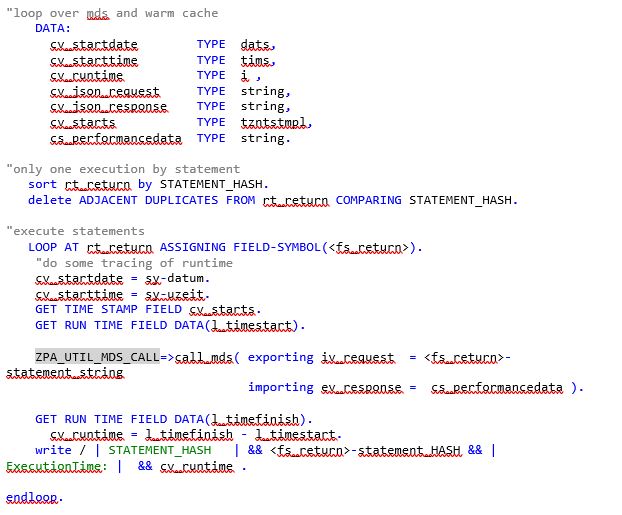
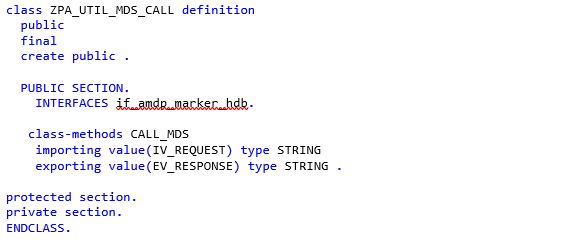
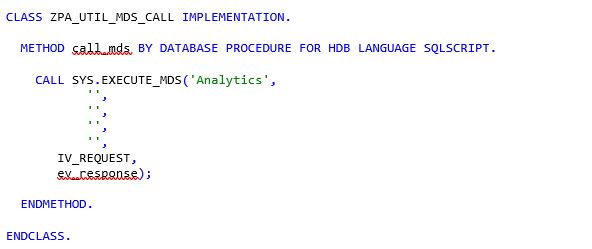
An ABAP class (ZPA_UTIL_MDS_CACHE) is used like an SQL interface to call SYS.EXECUTE_MDS for executing the MDS statement. This is needed to include the interface marker if_amdp_marker_hdb needed for the SQL call.

Warm up MDS Cache
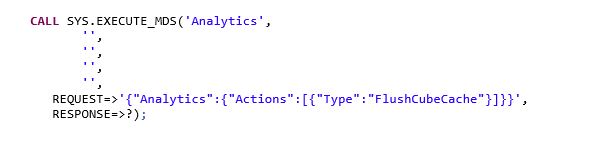
Before creating new MDS Cache entries we will flush the cache with the following statement via SQL interface.
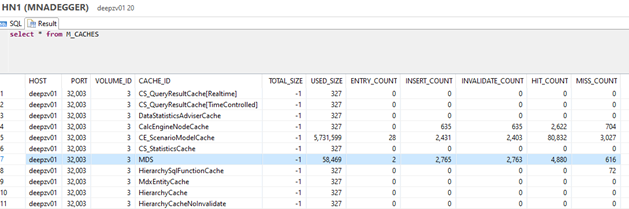
Now we check via SQL interface view M_CACHES in row MDS column entry_count.

Now we execute are ABAP Report for the story with the following parameters.
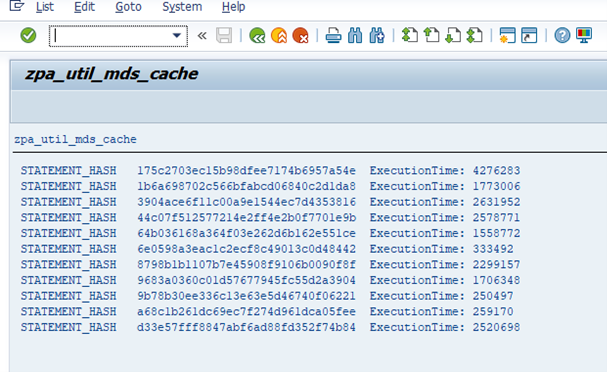
As an output we get a list of statement hashes that are executed and execution time.
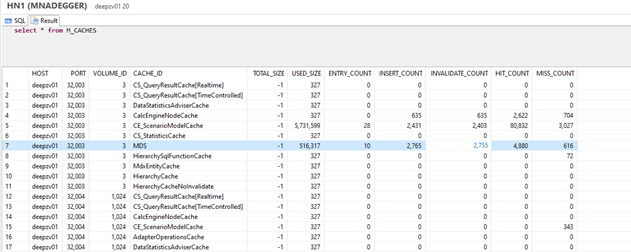
Now we check again via SQL interface view M_CACHES in row MDS column entry_count, having now 8 new entries added to the cache.

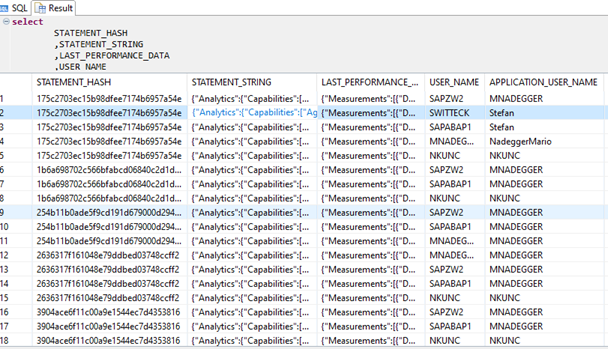
Now we will have a closer look at performance data for statements with the help of the following SQL.
Line 13 and 14 is showing the same statement_hash for 2 different USER_NAME. In that case SAPZW2 is our ABAP System User executing the statement via our ABAP Report. Due to the fact we are deleting cache before the execution could not hit any cache and column TOTAL_DATA_CACHE_HIT_COUNT is showing 0. Line 14 with APPLICATION_USER_NAME MNADEGER already having 10 TOTAL_DATA_CACHE_HIT_COUNTs.
Now we call the story in browser in private mode and check again performance data.
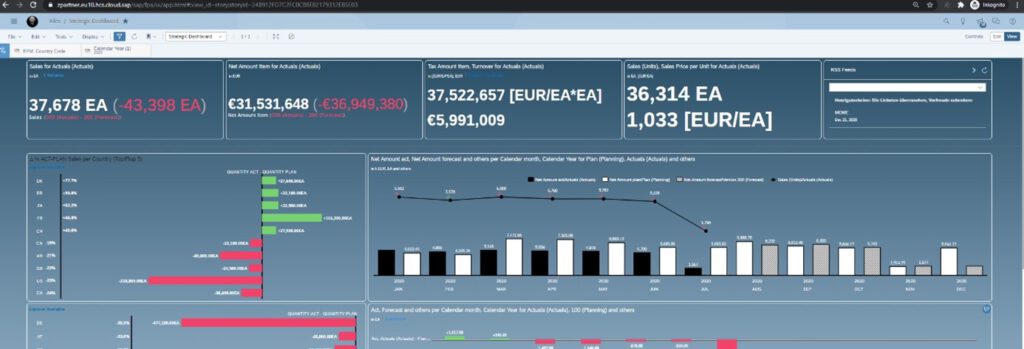
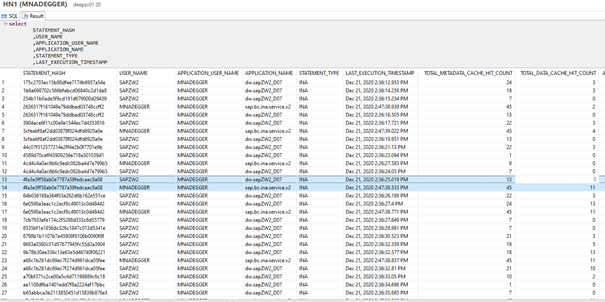
TOTAL_DATA_CACHE_HIT_COUNTs for APPLICATION_USER_NAME MNADEGGER in line 14 went up by one entry and indicates that the cache was hit.
Conclusion
Performance is always an issue in analytics an especially for dashboards. The old principle to warm up the cache could help to optimize end user experience. Steering this warm up for SAP Analytic Cloud Stories connected via HANA Live Data Connection via ABAP report could be an option the use this old principle for your new cloud based reporting.
Click here to see the blog: „How to trace widgets in SAP Analytics Cloud stories connected via HANA Live Data Connection“