The Future of Planning in Excel: The SAP Analytics Cloud Add-in as a Strategic Frontend – Part 2/3: Data Validation
In the first part of this series, we introduced the SAP Analytics Cloud (SAC) add-in for Microsoft Office and positioned it as the strategic successor to Analysis for Office. We covered its modern architecture, seamless integration, and how to build a basic interactive planning sheet.
Now it’s time to move beyond simple data display and entry. In this second instalment, we’ll dive into one of the most powerful aspects of the add-in: how it works together with native Excel formulas. We’ll show how to use those formulas to create a practical, robust, and essential tool for any planner: a self-service data-validation sheet.
Use case
In most planning processes, a small group of “key users” monitors and oversees progress. They remind contributors to enter data, catch mistakes early, and help maintain overall planning quality.
In later stages of a planning cycle, it becomes strategically important to know what changed compared to yesterday and why it changed. To streamline this, the SAP Analytics Cloud add-in can be combined with standard Excel techniques to build a lightweight validation hub.
Step 1: Create summary tables for the relevant dimensions
Create one or more SAC-connected tables that summarise your planning data by the dimensions you care about.
Example: in this post we use Country and Material, but in your scenario, it could be Cost Center, Product Group, Customer, etc.
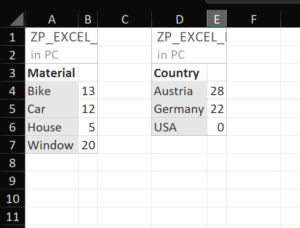
Make sure each table is clearly labelled and, if helpful, filtered to the current planning year for quick scanning.
Step 2: Build a validation sheet with native Excel formulas
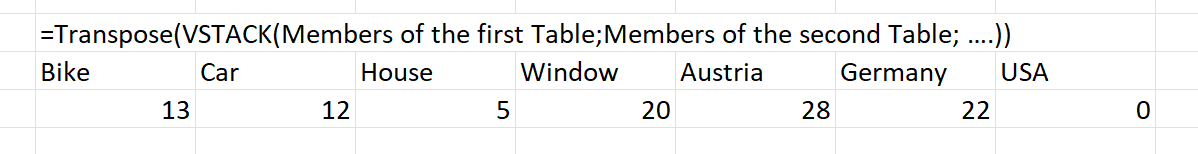
On a separate worksheet (“Validation” or similar), use standard Excel functions to pull and compare values from the SAC-connected tables.
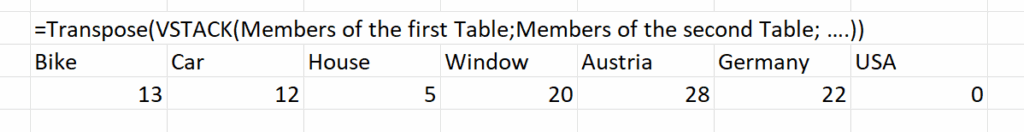
This gives you a single list of values drawn from your summary tables, ready for checks and comparisons.
Tips for the validation sheet
- Lookup & aggregation: Use XLOOKUP, INDEX/MATCH, SUMIFS, or AGGREGATE to retrieve totals for each combination (or whichever grain you need).
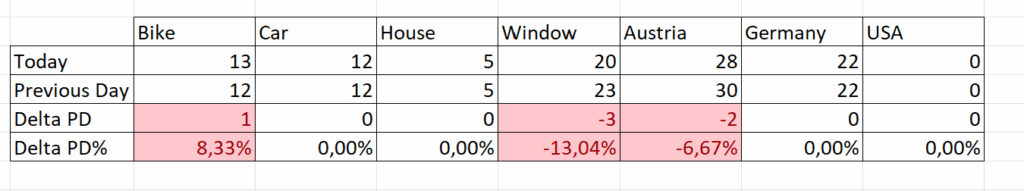
- Change tracking: Add a “Yesterday” (or “Baseline”) column populated from a prior snapshot (copy-pasted values, a versioned table, or a dated export). Then compute Delta columns.
- Quality checks: Use simple rules to flag issues like:
- Missing values where entries are required.
- Negative or unusually large values.
- Unexpected zeros for active entities.
- Conditional formatting: Highlight deltas above a threshold, blanks, or outliers so key users can see problems immediately.
- Filters & slices: Add filters (e.g., by Region, Planner, Version) to narrow the validation view during review meetings.
- Notes column: Include a free-text column so reviewers can record the reason for changes (price update, volume re-forecast, currency effect, etc.).
Why this works
- Self-service: Planners and key users can validate data in Excel without leaving the SAC context.
- Speed: Native formulas keep it fast and flexible; no macros required.
- Governance: Clear flags and notes improve auditability and help explain variances.
What’s next – Part 3
In the final part of this series, we’ll show you how to transform your Excel sheet into a lightweight automation hub, enabling automatic data entry and streamlined updates to parameter values across your planning solution.
Related Blogs
Author: Alexander Maislinger
Alexander is a experienced Business Intelligence Consultant renowned for architecting and delivering native SAP Analytics Cloud planning and reporting solutions, as well as pioneering SAP Datasphere and Seamless Planning implementations. He has led cross-functional BI teams and driven end-to-end planning and reporting programs, shaping BI strategy, defining technical architectures, and enforcing coding best practices while overseeing resource allocation, budget control, and service ownership. A specialist in requirements engineering, stakeholder engagement, data governance, and process optimization, Alexander combines exceptional analytical acumen with deep technical insight to deliver robust, scalable BI solutions.