From TikTok to Data Talk: Why SAP SAC Just Got a Whole Lot Cooler
Let’s be honest — attention spans today are shorter than loading spinner on a slow dashboard. We are living in a world where a 15-second TikTok can teach you how to cook risotto, fix your Wi-Fi, and survive a bear attack. Meanwhile, your classic 75-slide data presentation? Snooze button.
With the new “Video Data Story” feature, SAC is borrowing a page from the social media playbook to revolutionize the way we tell data stories. It is all about making insights digestible, dynamic, and dare we say it… binge-worthy. Let us dive in.
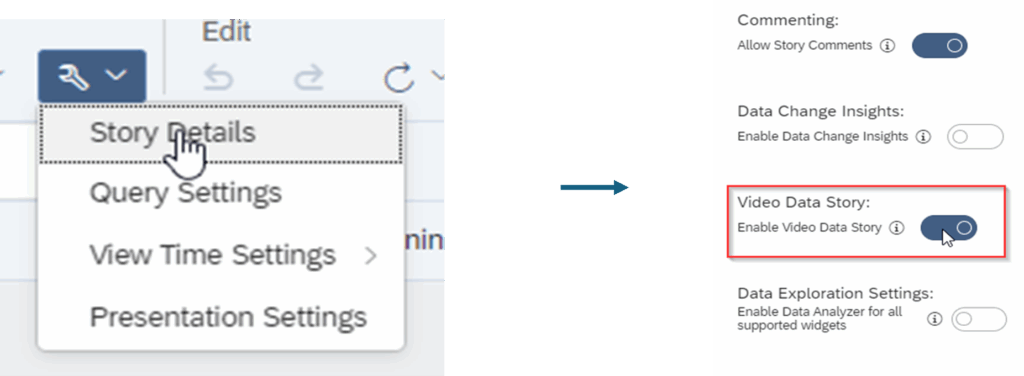
Since QRC1 2025 SAP Analytics Cloud you can activate the feature on your Story. In Edit Mode of your story Go to the Story Details and turn on the Toggle for Video Data Story:
1. To Create your Video Data Story go into the view mode and click on the 3 Dots on your chart:
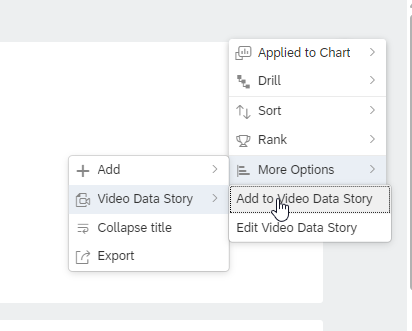
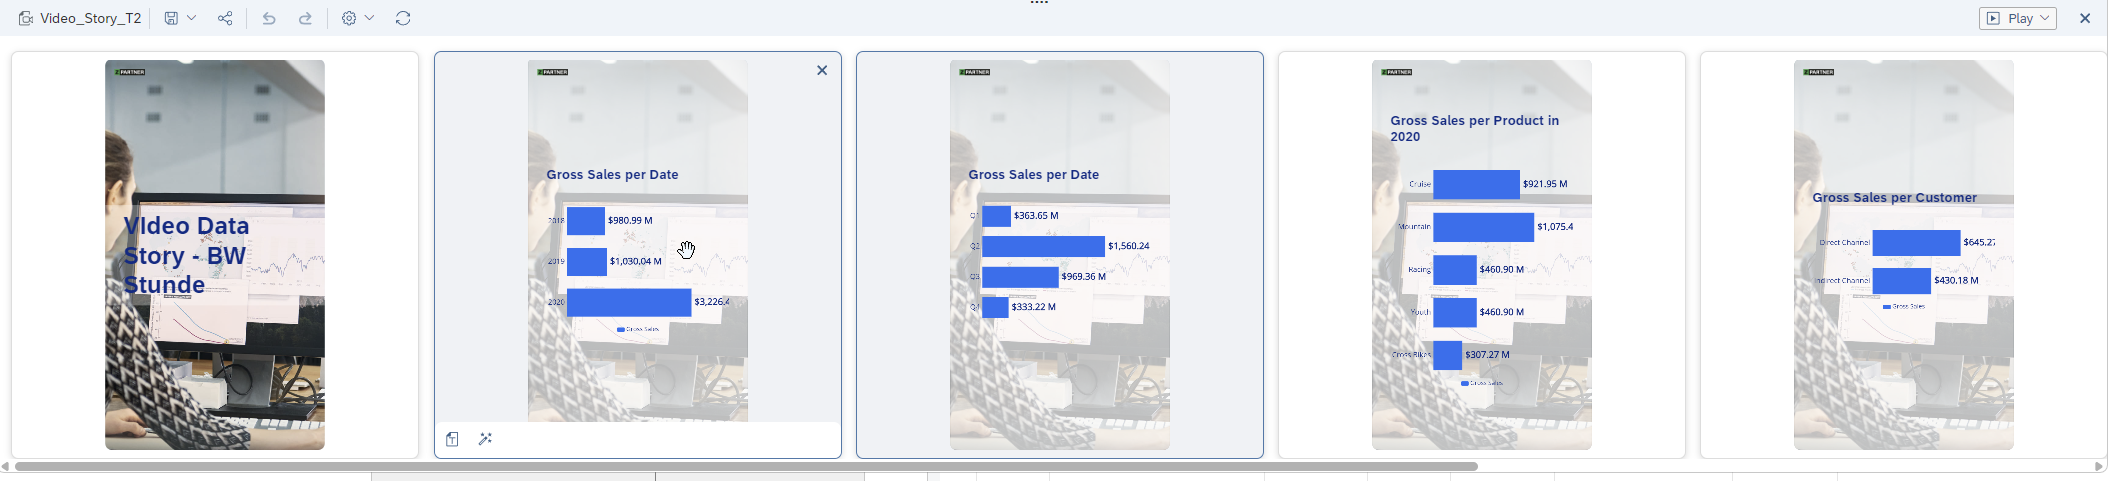
2. The Chart object is transferred to the Video Edit Pane at the bottom.
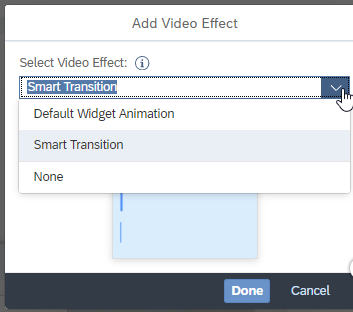
3. You can add other charts or the same chart with different filtering or Drilldown on hierarchies and set a transition.
Note: the video Effect “Smart Transition” only appears if you have used the same chart and adjusted the navigation depth.
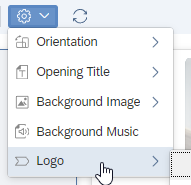
4. Set the Titles (First Page or Chart Snippets), Background Image or Music.
5. Preview or even Download the Video on the right side of the Editing Pane.
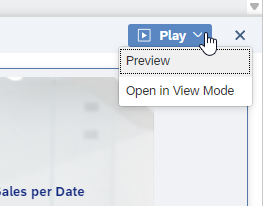

6. Share your Created Video Data Story with Others by simply sending the URL to your colleagues.
Please note that the “Video Data Story” is a separate Design artifact which is directly connected to the story you have started your creation.
Additional Information
Please note that the current state of this feature has some limitations. Currently supported:
- Bar/Column chart
- Line chart
- Pie chart
- Numeric Point chart
- Text widget
Additionally, the charts should only have one dimension and key figure otherwise you will get the following error message.
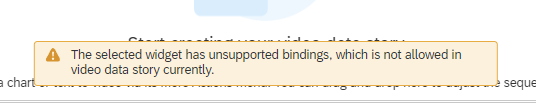
Also, other features like Variances and Reference are currently not supported. (Nothing on the roadmap so far)
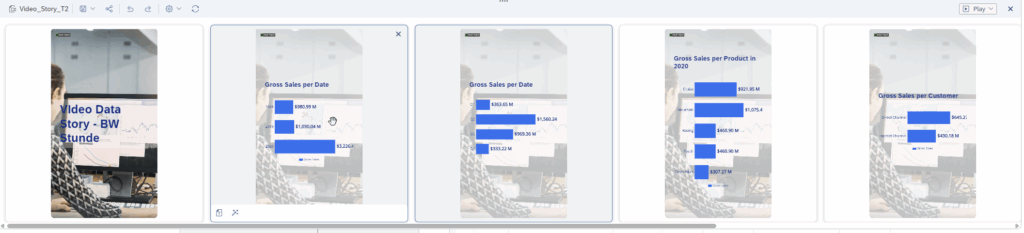
Example

Conclusion
This feature is more than just cool tech — it solves a real-world problem: getting stakeholders to engage with data. A short, curated video that walks someone through what matters? That is a sweet spot of clarity + convenience.
If we get some improvements on the features for adding more chart types and flexibility on the video content itself, this could be something transformative for how insights are shared across teams.