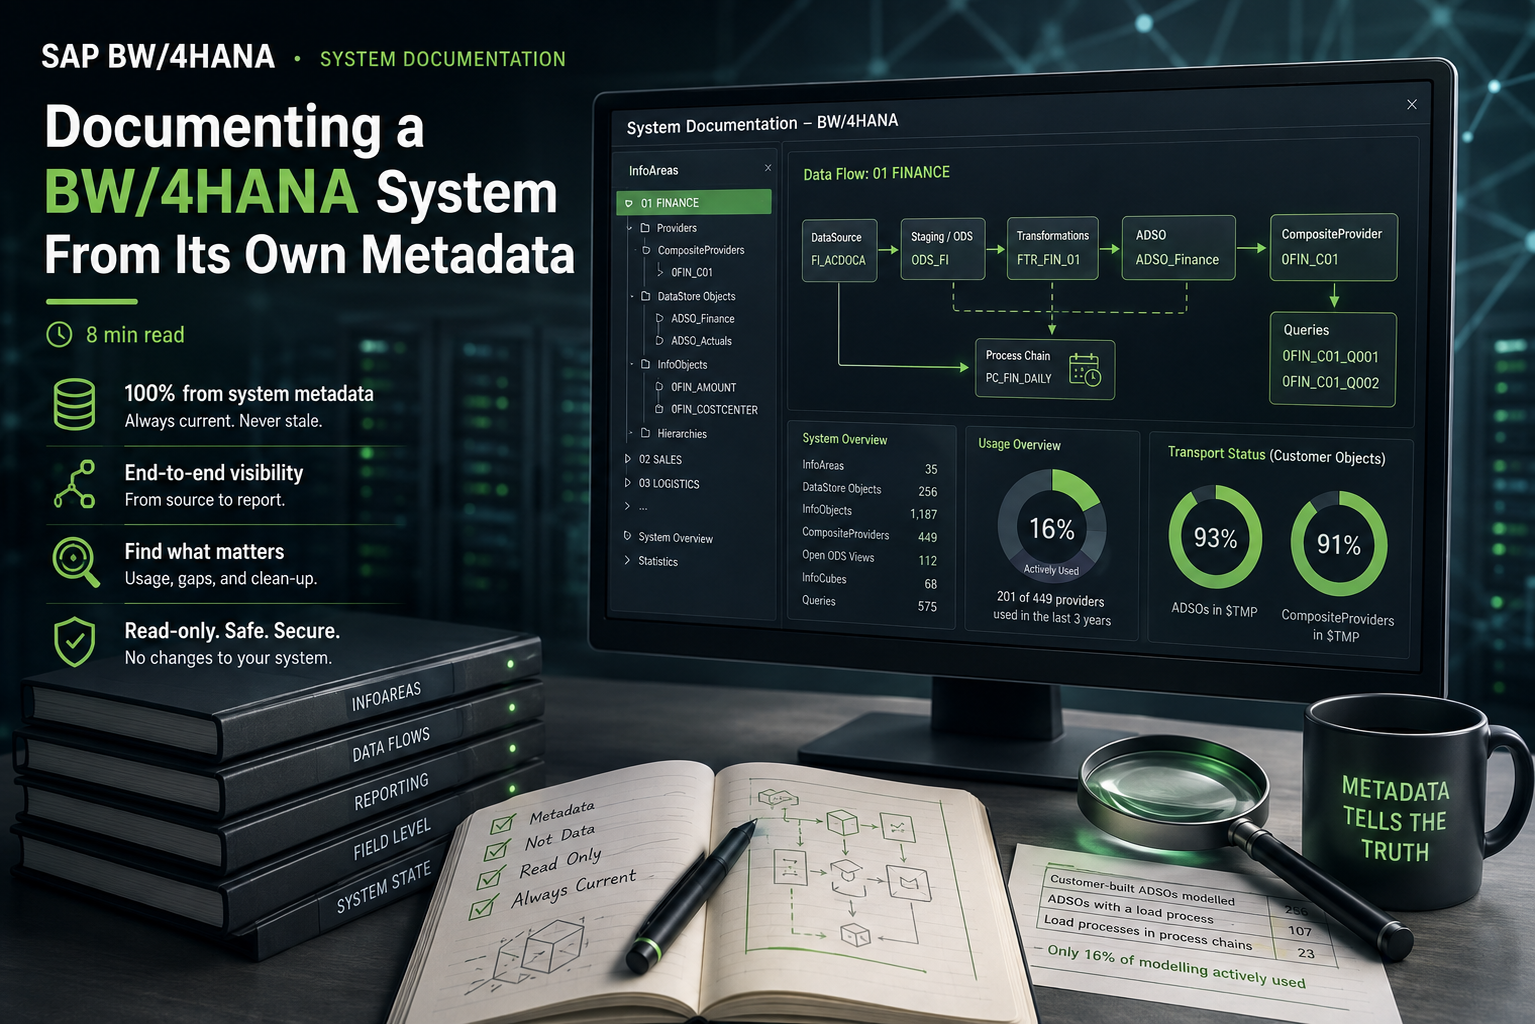
Every BW system carries its own documentation inside it. Not in a Word file that went stale three projects ago, but in a few hundred metadata tables that describe every InfoArea, every DataStore Object, every transformation and every query in the system. The information is complete and always current. It is simply unreadable.
We spent a while turning that metadata into something a person can actually use: a single self-contained HTML file that lets you pick an InfoArea and see what lives in it, follow the data flow from source to report, click any object to find out where it is used, and — the part that turned out to matter most — get a list of everything that looks like it should be cleaned up.
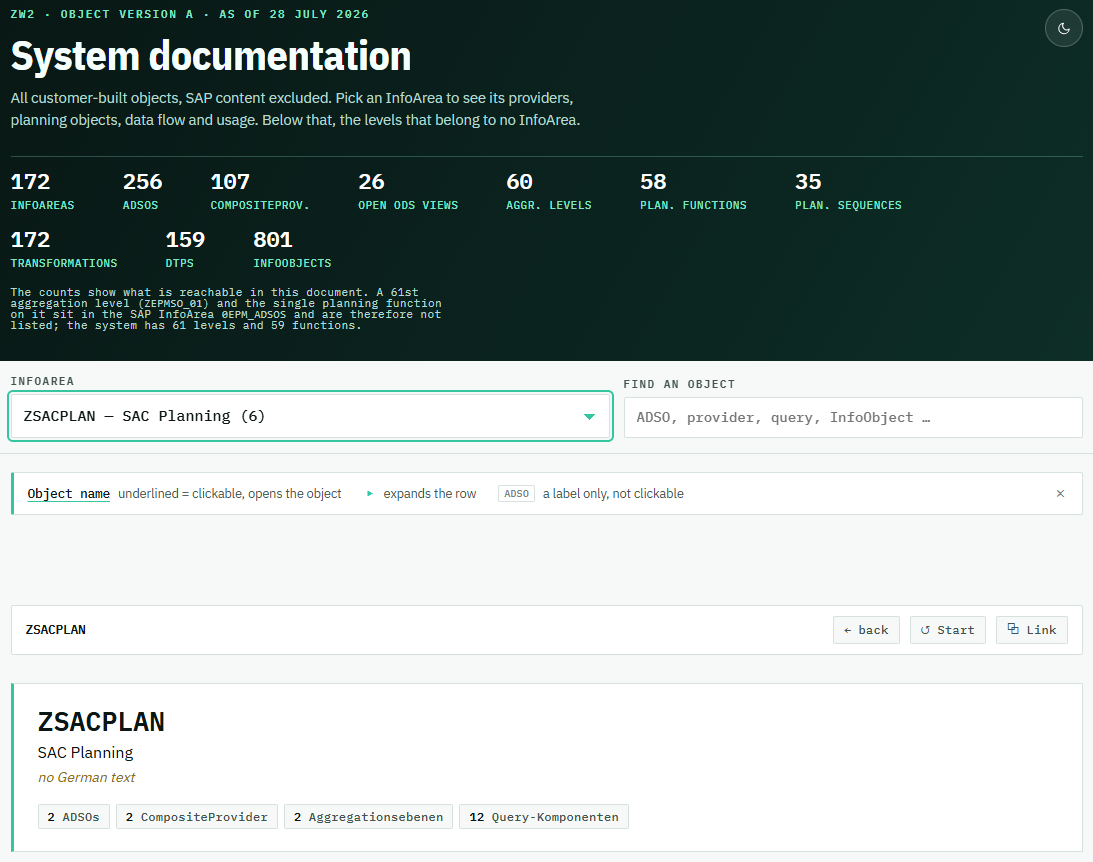
The interactive system documentation: pick an InfoArea, drill into providers, data flow and planning objects.
This post is about how we approached it, what we learned, and where the traps are. The system we worked on is a BW/4HANA landscape with roughly 2,100 customer-built objects alongside SAP content. The numbers below come from that system; the lessons apply to any of them.
The goal: documentation that cannot go stale
Hand-written system documentation has one structural problem: the moment someone adds an ADSO, the document is wrong, and nobody notices. So the goal was never „write a document“. It was „generate the document from the system, so that regenerating it is cheaper than maintaining it“.
That reframing changes what you build. You stop writing prose about individual objects and start building a rendering of the metadata. Two artefacts came out of it:
- A statistics page — how many objects of each type exist, how many are customer-built versus SAP content, how well texts are maintained, what state the operational settings are in. One page, answers the question „what am I dealing with here“ in thirty seconds.
- An interactive system documentation — the drill-down. Pick an InfoArea, see its providers, its data flows, its planning objects. Click through to any object and see its fields, the queries on it, the load processes that fill it, the process chains that schedule it.
Both are single HTML files with all data embedded. No server, no database, no dependencies. You can email them.
The approach: read-only, table by table
We read the metadata through a read-only ADT connection — the same interface Eclipse uses — and never wrote anything to the system. Every number in the output traces back to a specific table and a specific query, which matters more than it sounds: when a figure looks wrong, you need to be able to check it.
The order that worked:
- Object inventory — InfoAreas, ADSOs, InfoObjects, CompositeProviders, Open ODS Views, hierarchies. Names, texts, hierarchy of areas.
- Data flow — transformations, DTPs, DataSources, process chains. This is where the system starts to make sense, because you can finally see what feeds what.
- Reporting and planning — queries, filters, variables, aggregation levels, planning functions and sequences.
- Field level — which InfoObjects sit in which ADSO, and the reverse.
- State — data volumes, last usage, transport status, authorisations.
Steps 1 to 3 give you a catalogue. Step 4 makes it searchable down to the field level — and incidentally reveals which InfoObjects are used in no ADSO at all. Step 5 turns the whole thing into something you can act on.
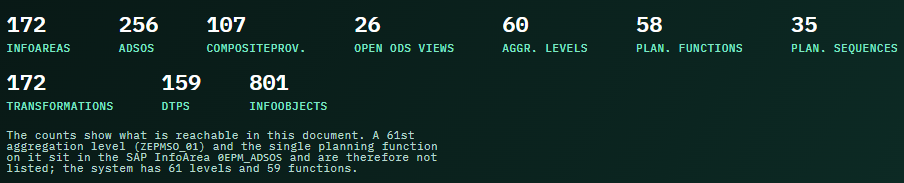
What the generated documentation counts, with the two excluded objects noted.
What the numbers said
The most useful output was not any single object page. It was the gap between three figures:
| Customer-built ADSOs modelled | 256 |
| ADSOs with a load process | 107 |
| Load processes scheduled in a process chain | 23 |
And on the reporting side: of 449 customer-built providers, 201 had ever been queried, and 129 of those had not been touched in over three years. Roughly 16 % of the modelling was in active use.
None of this is visible from any single transaction. It only appears when you put the object inventory next to the request history and the OLAP statistics — which is exactly what generated documentation is good at and hand-written documentation never does.
The transport status was the finding nobody expected. We first noticed one CompositeProvider sitting in the local $TMP package and flagged it as a tidiness issue. When we queried TADIR systematically, it turned out that 93 % of the ADSOs and 91 % of the CompositeProviders were in $TMP. The system was not transportable at all. The single-object finding had pointed in exactly the wrong direction.
Best practices
- Verify every table name before you use it. BW naming is deceptively regular and then suddenly is not. InfoArea texts are in RSDAREAT, ADSO texts in RSOADSOT — but the ADSO directory is RSOADSO, not RSDADSO, and there is no symmetry to lean on. Guessing costs more than checking.
- Get a count before you get a list. Every list you pull should be checked against a COUNT from the same table. This catches truncated results, which are the most dangerous failure mode because they look like valid data. At one point a repository search capped at fifteen hits and we nearly concluded that a text table did not exist.
- Never rebuild from your own summaries. This was the most expensive lesson. We had written intermediate analyses in Markdown, collapsing ranges like ZEPA030_CKF_EPM00001–00008 for readability. When the documentation was later generated from those summaries instead of the source tables, 111 of 473 query components silently disappeared. Generate from raw data, always.
- Distinguish data from metadata. Hierarchy node contents, runtime totals, record counts — these change with every load. Putting a snapshot of them into documentation makes the document wrong by tomorrow. Structure, texts, relationships, transport status and last-used dates are a different matter: they are properties of the object, not of yesterday’s load. Those stay. We got this wrong initially and put runtime aggregates on every object page before removing them again.
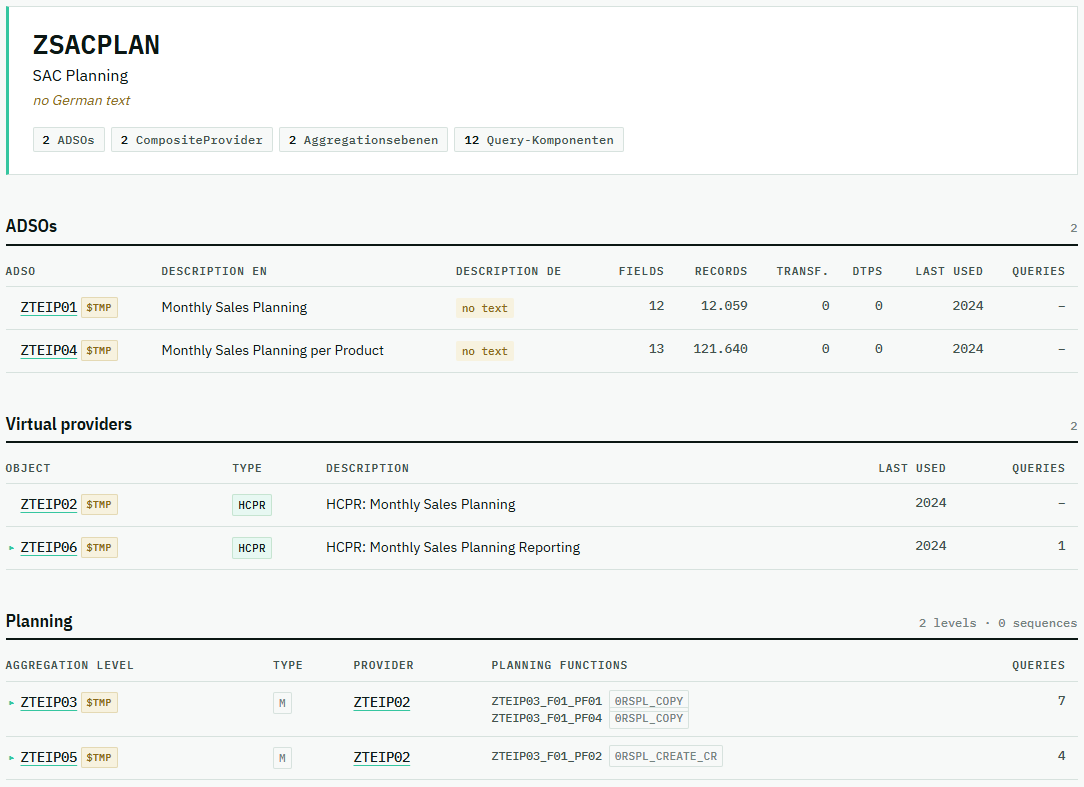
Drilling into an InfoArea: ADSOs, virtual providers and planning levels, each linking to its own object page.
- Say what you did not measure. Some things genuinely cannot be counted. Transformations have no name of their own — they are identified by source and target — so „how many custom transformations exist“ has no answer. We labelled that figure „touches a customer-built ADSO“ instead, with a footnote. A documented gap is useful; an invented number is worse than nothing.
- Run the artefact, do not just check its syntax. Four of our worst bugs were syntactically perfect: a code block accidentally deleted during an edit, a data field never written into the page, two table columns swapped, and 41 load processes missing entirely because they were attached to InfoObjects rather than ADSOs. All four were found by loading the finished file in a headless DOM and clicking through it. None would have been found by a syntax check.
- Withdraw wrong findings visibly. Our clean-up list initially reported five sets of „duplicate DTPs“. The DTP descriptions later showed that all five loaded different things — attributes versus texts versus individual hierarchies. Rather than quietly deleting the finding, we kept it as a withdrawn entry explaining what it had claimed and why it was wrong. The next reader will not repeat the misreading.
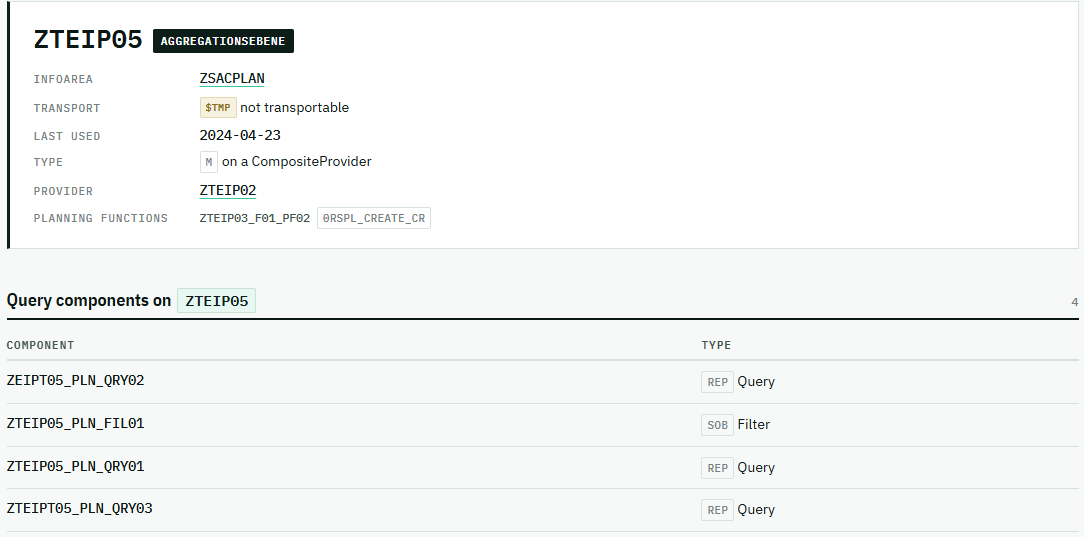
An aggregation level’s object page, showing its query components.
What to watch out for on the SAP side
A handful of specific traps cost us real time. In rough order of how much:
- The ADSO field list is not where you would look for it. Not in RSOADSOFIELDMAP (that is only the mapping of generated InfoObjects), not in RSOADSOPART (partitioning), and RSDCUBEIOBJ contains nothing for ADSOs at all. The fields live in the generated active table /BIC/A<adso>2 and are read through DD03L.
- RSBKDTP does not tell you what kind of InfoObject target a DTP has. Target type is IOBJ, full stop — not whether attributes, texts or a specific hierarchy are being loaded. Four DTPs with identical target, source and mode can be loading four different things. Only the description in RSBKDTPT reveals it.
- RSPCCHAIN has no successor field. Chain order is encoded in event pairs: one step’s EVENTP_GREEN is the next step’s EVENTP_START. You have to walk it. The reward is worth it — this is how you find out whether a self-referencing load runs before or after activation, which determines whether the data is right.
- Text tables are not uniform. RSOADSOT mixes object texts with field and dimension texts, distinguished by TTYP = ‚EUSR‘. RSOHCPRT has no TTYP at all — the object text is the row where COLNAME is empty. And RSDIOBJT contains language records with no content whatsoever: on our system, 59 German entries had neither a short nor a long text. Counting rows overstates translation coverage.
- S_RS_COMP, S_RS_AUTH and friends are authorisation objects, not tables. Searching for tables by those names returns nothing. Their values live in AGR_1251. Worth checking early: on our system nine custom analysis authorisations existed and not one was assigned to any role — every assignment granted 0BI_ALL or *.
- Some things have no table. The composition of a CompositeProvider — which providers feed it — is not stored in a queryable table anywhere in package RSO_RES_HCPR. It exists only in the object’s XML definition, retrievable one object at a time. Same for DTP filter selections. When you hit this, the honest answer is to document the gap rather than approximate it from naming conventions.
What it delivered
A picture of the system that did not exist before. Not a list of objects — those you can always get — but the shape: which layers carry the model, where the data actually flows, what is alive and what is not. One file, no infrastructure, works offline, fits in an email. A new colleague can see how the system is put together in half an hour instead of a fortnight of clicking through transactions.
Questions that used to be small projects. „Which InfoObjects sit in no ADSO?“ „Which chains have not run this year?“ „What is still in the local package?“ Each of those used to mean a workshop, a spreadsheet and a week of waiting. Against collected metadata they are one query. That change in cost is what makes people start asking.
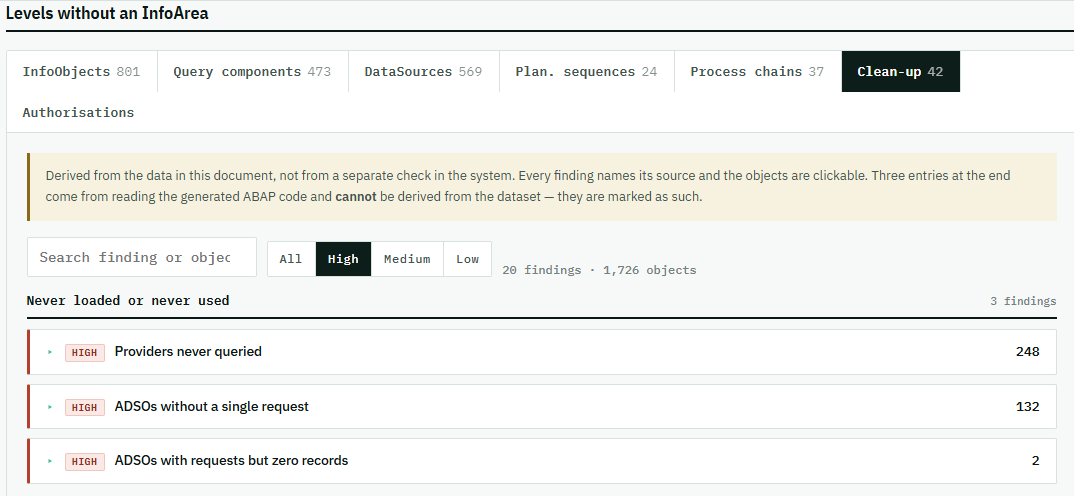
The clean-up list, sorted by severity, with the finding counts behind it.
A clean-up list somebody can actually work through. 42 findings across roughly 3,300 objects, each one linked to the object in question: never loaded, never queried, duplicated, empty, untransportable, inconsistent. All of it was already sitting in the metadata. It only needed to be put side by side — and that is exactly the kind of work that generated documentation does well and manual review reliably misses.
And it carries to the next system. The sequence of tables, the order to read them in, the traps — that is transferable. The first system costs the learning; the second one costs an afternoon. For anyone who looks at more than one BW landscape, that is where the real return sits.
None of this makes the exercise finished. Generated documentation is only as trustworthy as your willingness to check it against the source, and several of our own figures were wrong until we did: a count that turned out to be inverted, a repository search that had been silently truncated, a table column that had shifted by one. None of those look wrong on the page — they look like data. Comparing every figure back to the query that produced it is the cheapest quality gate you have, and the only one that catches this class of mistake.
All figures come from a single BW/4HANA system and are reported as measured. Where a number could not be measured, the text says so. Table names refer to standard BW metadata tables and were verified in the repository before use.
Try it out – our offline version: https://www.zpartner.eu/AIDocu.html