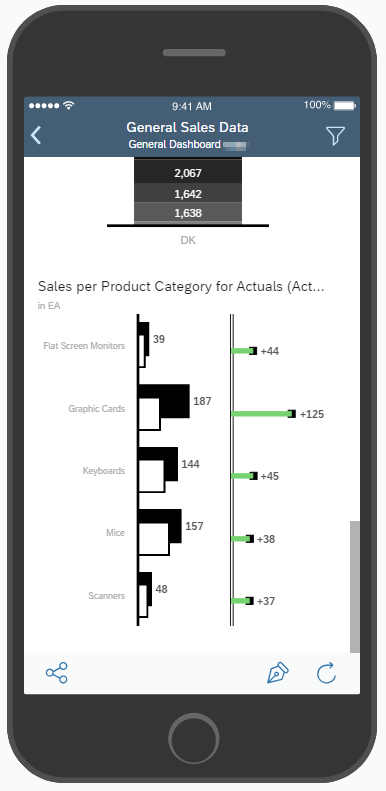
How-To make a SAC Story Mobile ready
Introduction This How-to Paper provides guidance for an end-user on which settings/changes are necessary to make a new/existing SAP Analytics Cloud Story […]
Introduction This How-to Paper provides guidance for an end-user on which settings/changes are necessary to make a new/existing SAP Analytics Cloud Story […]
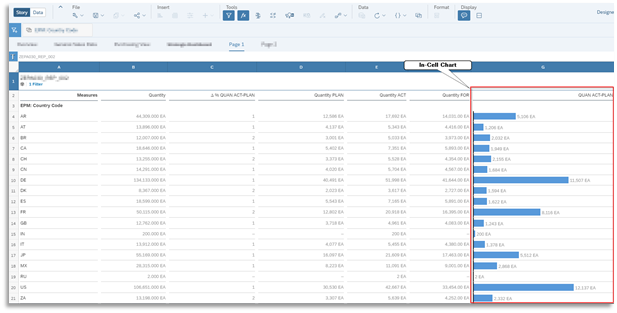
Introduction This How-to Paper provides guidance on how to display a deviation in a table in the SAP Analytics Cloud in conformity […]